Download
1 / 29
290 likes | 386 Vues
NWP2008. Empirical Mode Reduction and its Applications to Nonlinear Models in Geosciences. D. Kondrashov University of California, Los Angeles. Joint work with Michael Ghil, Ecole Normale Sup ér ieure and UCLA; Sergey Kravtsov, U. Wisconsin–Milwaukee; Andrew Robertson, IRI, Columbia U.

E N D
NWP2008 Empirical Mode Reduction and its Applications to Nonlinear Models in Geosciences D. Kondrashov University of California, Los Angeles Joint work with Michael Ghil, Ecole Normale Supérieure and UCLA; Sergey Kravtsov, U. Wisconsin–Milwaukee; Andrew Robertson, IRI, Columbia U. http://www.atmos.ucla.edu/tcd/
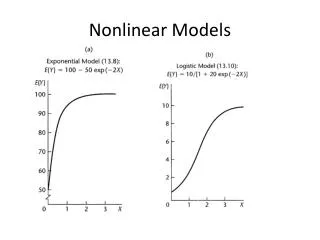
Motivation • Sometimes we have data but no models: empirical approach. • We want models that are as simple as possible, but not any simpler. Criteria for a good data-derived model Capture interesting dynamics: regimes, nonlinear oscillations. • Intermediate-order deterministic dynamics easy to analyze anallitycaly. • Good noise estimates.
Linear Inverse Models (LIM) Penland, C., 1996: A stochastic model of Indo-Pacific sea-surface temperature anomalies. Physica D, 98, 534–558. Penland, C., and L. Matrosova, 1998: Prediction of tropical Atlantic sea-surface temperatures using linear inverse modeling. J. Climate, 11, 483–496. Linear inverse models (LIM) are good least-square fits to data, but don’t capture all the (nonlinear) processes of interest.
Nonlinear reduced models (MTV) Majda, A. J., I. Timofeyev, and E. Vanden-Eijnden, 1999: Models for stochastic climate prediction. Proc. Natl. Acad. Sci. USA, 96, 14687–14691. Majda, A. J., I. Timofeyev, and E. Vanden-Eijnden, 2003: Systematic strategies for stochastic mode reduction in climate. J. Atmos. Sci., 60, 1705–1722. Franzke, C., and Majda, A. J., 2006: Low-order stochastic mode reduction for a prototype atmospheric GCM. J. Atmos. Sci.,63, 457–479. MTV model coefficients are predicted by the theory. Relies on scale separation between the resolved (slow) and unresolved (fast) modes Their estimation requires very long libraries of the full model’s evolution. Difficult to separate between the slow and fast dynamics (MTV).
Nonlinear dynamics: Discretized, quadratic: Multi-level modeling of red noise: Key ideas
Nomenclature Response variables: Predictor variables: Each is normally distributed about Eachis known exactly. Parameter set {ap}: – known dependence of f on {x(n)} and {ap}. REGRESSION: Find
LIM extension #1 Do a least-square fit to a nonlinear function of the data: J response variables: Predictor variables (example – quadratic polynomial of J original predictors): Note: Need to find many more regression coefficients than for LIM; in the example above P = J + J(J+1)/2 + 1 = O(J2).
Regularization • Caveat: If the number P of regression parameters is comparable to (i.e., it is not much smaller than) the number of data points, then the least-squares problem may become ill-posed and lead to unstable results (overfitting) ==> One needs to transform the predictor variables to regularize the regression procedure. • Regularization involves rotated predictor variables: the orthogonal transformation looks for an “optimal” linear combination of variables. • “Optimal” = (i) rotated predictors are nearly uncorrelated; and (ii) they are maximally correlated with the response. Canned packages available.
LIM extension #2 Motivation: Serial correlations in the residual. Main level, l = 0: Level l = 1: … and so on … Level L: rL– Gaussian random deviate with appropriate variance • If we suppress the dependence on x in levels l = 1, 2,… L, then the model above is formally identical to an ARMA model.
Empirical Orthogonal Functions (EOFs) • We want models that are as simple as possible, but not any simpler: use leading empirical orthogonal functions for data compression and capture as much as possible of the useful (predictable) variance. • Decompose a spatio-temporal data set D(t,s)(t= 1,…,N; s = 1…,M) by usingprincipal components (PCs) – xi(t)and empirical orthogonal functions (EOFs) – ei(s): diagonalize the M x Mspatialcovariance matrixC of the field of interest. • EOFs are optimal patterns to capture most of the variance. • Assumption of robust EOFs. • EOFs are statistical features, but may describe some dynamical (physical) mode(s).
Empirical mode reduction (EMR)–I • Multiple predictors: Construct the reduced model using J leading PCs of the field(s) of interest. • Response variables: one-step time differences of predictors; step = sampling interval = t. • Each response variable is fitted by an independent multi-level model: The main levell = 0 is polynomial in the predictors; all the other levels are linear.
Empirical mode reduct’n (EMR) – II • The number L of levels is such that each of the last-level residuals (for each channel corresponding to a given response variable) is “white” in time. • Spatial (cross-channel) correlations of the last-level residuals are retained in subsequent regression-model simulations. • The number J of PCs is chosen so as to optimize the model’s performance. • Regularization is used at the main (nonlinear) level of each channel.
ENSO – I Data: • Monthly SSTs: 1950–2004, 30 S–60 N, 5x5 grid (Kaplan et al., 1998) 1976–1977 shift removed • Histogram of SST data is skewed (warm events are larger, while cold events are more frequent): Nonlinearity important?
ENSO – II Regression model: J = 20 variables (EOFs of SST) L = 2 levels • Seasonal variations included in the linear part of the main (quadratic) level. The quadratic model has a slightly smaller RMS error in its extreme-event forecasts • Competitive skill: Currently a member of a multi-model prediction scheme of the IRI, see: http://iri.columbia.edu/climate/ENSO/currentinfo/SST_table.html.
ENSO – III ENSO development and non-normal growth of small perturbations (Penland & Sardeshmukh, 1995; Thompson & Battisti, 2000); Floquet analysis : • Maximum growth: (b) start in Feb., (c) = 10 months V – optimal initial vectors U – final pattern at lead
NH LFV in QG3 Model – I The QG3 model (Marshall and Molteni, JAS, 1993): • Global QG, T21, 3 levels, with topography; perpetual-winter forcing; ~1500 degrees of freedom. • Reasonably realistic NH climate and LFV: (i) multiple planetary-flow regimes; and (ii) low-frequency oscillations (submonthly-to-intraseasonal). • Extensively studied: A popular “numerical-laboratory” tool to test various ideas and techniques for NH LFV.
NH LFV in QG3 Model – II Output: daily streamfunction () fields ( 105 days) Regression model: 15 variables, 3 levels (L = 3), quadratic at the main level Variables: Leading PCs of the middle-level • No. of degrees of freedom = 45 (a factor of 40 less than in the QG3 model) • Number of regression coefficients P = (15+1+15•16/2+30+45)•15 = 3165 (<< 105) Regularization via PLS applied at the main level.
NH LFV in QG3 Model – III • Our EMR is based on 15 EOFs of the QG3 model and has L = 3 regression levels, i.e., a total of 45 predictors (*). • The EMR approximates the QG3 model’s major statistical features (PDFs, spectra, regimes, transition matrices, etc.) strikingly well.
NH LFV in QG3 Model – II Quasi-stationary states of the EMR model’s deterministic component explain dynamics! Tendency threshold • = 10–6; and • = 10–5. The 37-day mode is associated, in the reduced model with the least-damped linear eigenmode. AO– is the model’s unique steady state. • Regimes AO+, NAO– and NAO+ are associated with anomalous slow-down of the 37-day oscillation’s trajectory nonlinear mechanism.
NH LFV in QG3 Model – III The additive noise interacts with the nonlinear dynamics to yield the full EMR’s (and QG3’s) phase-space PDF. Panels (a)–(d): noise amplitude = 0.2, 0.4, 0.6, 1.0.
NH LFV – Observed Heights • 44 years of daily 700-mb-height winter data • 12-variable, 2-level model works OK, but dynamical operator has unstable directions: “sanity checks” required.
Mean phase space tendencies 2-D mean tendencies <(dxj,dxk)>=F(xj,xk) in a given plane of the EOF pair (j, k) have been used to identify distinctive signatures of nonlinear processes in both the intermediate QG3 model (Selten and Branstator, 2004; Franzke et al. 2007) and more detailed GCMs (Branstator and Berner, 2005). Relative contributions of ”resolved” and ”unresolved” modes (EOFs) that may lead to observed deviations from Gaussianity; it has been argued that contribution of ”unresolved” modes is important. We can estimate mean tendencies from the output of QG3 and EMR simulations. Explicitquadratic form of F(xj,xk) from EMR allows to study nonlinear contributions of ”resolved” and ”unresolved” modes.
Mean phase-space tendencies QG3 tendencies EMR tendencies Linear features for EOF pairs (1-3), (2-3) only: antisymmetric for reflections through the origin; constant speed along ellipsoids (Branstator and Berner, 2005). Very good agreement between EMR and QG3!
“Resolved” vs. “Unresolved”? • It depends on assumptions about ”signal” and ”noise”. We consider EOFs xi (i ≤ 4) as ”resolved” because: - these EOFs have the most pronounced deviations from the Gaussianity in terms of skewness and kurtosis. - they determine the most interesting dynamical aspects of LFV; linear (intraseasonal oscillations) as well as nonlinear (regimes) (Kondrashov et al. 2004, 2006).
EMR Tendencies budget For a given xi (i≤4), we split nonlinear interaction xjxkas ”resolved” (set Ω of (j,k); j,k ≤4): TR = Nijk xj,xk -Ri, Ri = < Nijk xj,xk > and ”unresolved” for (j,k) ∉ Ω: TU =Nijk xj,xk +Ri + Fi Since Fi ensures < dxi > = 0: Fi = - < Nijk xj,xk > ∀ j,k we have <TR > = 0, <TU > = 0, and <TR +TU > = 0!
EMR Nonlinear Tendencies The nonlinear ”double-swirl” feature is mostly due to the ”resolved” nonlinear interactions, while the effects of the ”unresolved” modes are small!! Pronounced nonlinear double swirls for EOF pairs (1-2), (1-4), (2-4) and (3-4).
Concluding Remarks – I • The generalized least-squares approach is well suited to derive nonlinear, reduced models (EMR models) of geophysical data sets; regularization techniques such as PCR and PLS are important ingredients to make it work. Easy add-ons, such as seasonal cycle (for ENSO, etc.). • The dynamic analysis of EMR models provides conceptual insight into the mechanisms of the observed statistics.
Concluding Remarks – II Possible pitfalls: • The EMR models are maps: need to have an idea about (time & space) scales in the system and sample accordingly. • Our EMRs are parametric: functional form is pre-specified, but it can be optimized within a given class of models. • Choice of predictors is subjective, to some extent, but their number can be optimized. • Quadratic invariants are not preserved (or guaranteed) – spurious nonlinear instabilities may arise.
References Kravtsov, S., D. Kondrashov, and M. Ghil, 2005: Multilevel regression modeling of nonlinear processes: Derivation and applications to climatic variability. J. Climate, 18, 4404–4424. Kondrashov, D., S. Kravtsov, A. W. Robertson, and M. Ghil, 2005: A hierarchy of data-based ENSO models. J. Climate, 18, 4425–4444. Kondrashov, D., S. Kravtsov, and M. Ghil, 2006: Empirical mode reduction in a model of extratropical low-frequency variability. J. Atmos. Sci., 63, 1859-1877. http://www.atmos.ucla.edu/tcd/