Download
1 / 17
170 likes | 374 Vues
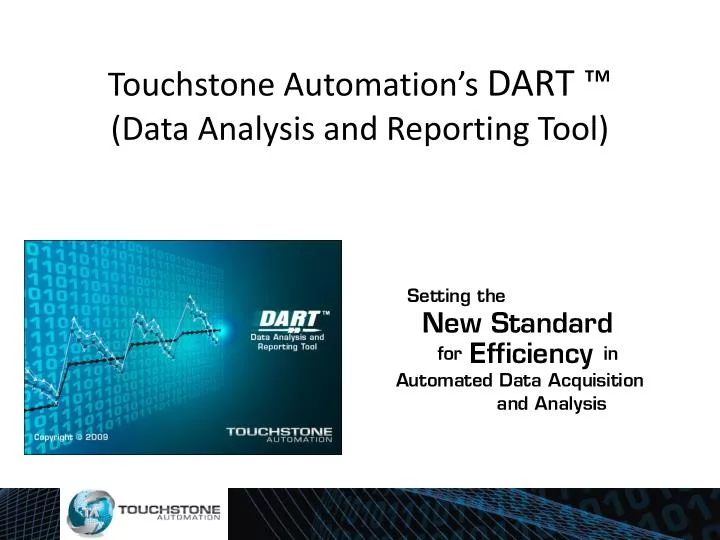
Touchstone Automation’s DART ™ (Data Analysis and Reporting Tool). Primary Benefits of DART. Centralized Data Storage No more searching for data on multiple computers and network drives Seamless integration of results from multiple sites Fixed Set of Data Tables

E N D
Touchstone Automation’s DART ™ (Data Analysis and Reporting Tool)
Primary Benefits of DART • Centralized Data Storage • No more searching for data on multiple computers and network drives • Seamless integration of results from multiple sites • Fixed Set of Data Tables • No data table creation or modifications required by end-user • Data Access from Anywhere • Multiple concurrent users of any data set, whether on site or remote • Fully Automated Report Output • Over 100 times faster than manual report generation • Simple reports generated in less than 30 seconds • Complete Flexibility in Data Selection (see next slide) • All part numbers, attributes, condition parameters and values, and output result parameters shown directly on the program window in list boxes. No guessing from memory or keyboard input of values for data filtering • Ease of Use and Customer Satisfaction • Intuitive and consistent user interface • Initial learning time averages less than 30 minutes for most users • Previous feedback (direct quotes) from different users include: “Best tool in my nine years of engineering”, “Best thing to happen to our company since...ever”, “Excellent tool – very easy to use, 10 out of 10”.
Simple Yet Flexible User Interface Fixed Attribute Selections here begin filtering at event level, controls below will update real-time Custom Attribute Selections filter further at event level Selections are then made here to select subset of available Conditions for reporting Finally, available Output Parameters are available for down-selection A limit set is selected (if applicable), and then a report type (Raw Data, Graphical, Compliance, etc) is selected from the menu at top of the form
Innovative Data Structures • Discrete Data • Complete flexibility in parameter naming • Capability of handling millions of data points for a single unit • Sweep Data • Stimulus and response values for all data points • Three value storage option enabling capture of full S parameter data • Flexible and Dynamic Attribute Storage • Store serial numbers, test descriptions, die lots, supplier codes, firmware revisions, calibration tool versions, test setups, etc., etc. • Attribute definitions customizable per part number as needed, with the option to add additional attributes after testing has begun • Flexible Condition and Result Sets • Condition values can change from one test run to another for the same test, with the superset of all tested conditions shown on the program window • Output result parameter lists can be expanded or reduced to meet immediate test needs, with full visibility of tested parameters shown on the program window
Report Format Examples • Microsoft Excel Output • Familiar to nearly all engineers • Customize output reports as desired to meet specific needs • Standard Charts • Line charts with results on Y-axis vs. X-axis and series conditions • Two parameter line charts • Multiple Conditions on X-Axis (example on following slide) • Provides at a glance view across a wide range of test conditions • Customizes, enhances, and speeds the manual pivot charting options • Failure Paretos (example in following slides) • Box Plots (example in following slides) • Histogram Charts (example in following slides) • Excel Sheets to Microsoft PowerPoint • Automated generation of data slide shows for meetings • Statistics Charts & Calculations • Plus and minus 3 sigma graphs • Scatter plots • Min, mean, max, median, quartiles, sigma, etc.
Report Formats (cont) • Compliance Matrices (example on following slide) • Minimum, average, maximum, sigma, Cpk, and worst case margin to specification calculated for every specification line item • Multiple specification limits for the same parameter with fully customizable condition lists, e.g. nominal limits as well as extreme condition limits • Multiple specification sets for a single part number • Graphical worst case margin to specification for multiple parameters on one graph • Top ten worst case margin to spec • Top ten worst Cpk • Compliance matrices automatically expanded by condition parameters such as frequency • Outlier limit entry and automated outlier handling • Customizable compliance report layout, group related items together • Traceability of Data • All report outputs include information to completely identify the data set selected
Report Formats (cont) • Batch Reports • Save multiple report selections in batch files for re-use • Expand, edit, and customize batch files as needed • Share batch files with other users • Batch a few reports or hundreds of reports at one time for later review • Output batched reports as a single PowerPoint slide presentation
Data Upload Options • Supported File Types • XLS/XLSX • CSV • TXT (Any delimiter) • WAT • ATDF • STDF • SnP • Manually Configured Upload (‘one-time’) • User loads first file and follows step-by-step instructions to define file configuration • Configuration may be saved for later use • Configuration may be applied to one file or an entire directory of files at a time • Fully-Formatted Upload • Data file fields formatted with special prefixes to define file configuration • No upload-time configuration required • From a single file up to an entire directory of files may be uploaded at one time
Contact Info: Info@TouchstoneAutomation.com