Download
1 / 1
10 likes | 102 Vues
Yeom Supplementary Fig.1C. C. Type of Gene Fold induction. 2.967 2.615 2.534 2.375 2.322 2.245 2.158 2.091 2.040 2.012. CHI3L1 ( Chitinase 3-like 1) PTX3 ( Pentraxin 3)

E N D
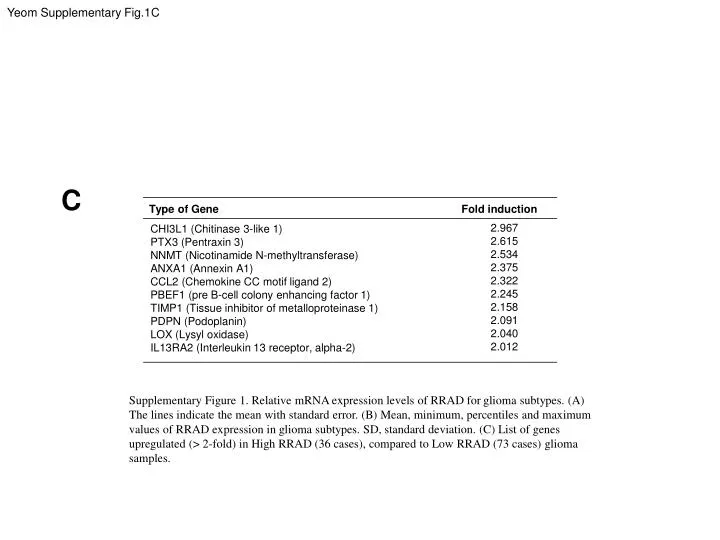
YeomSupplementary Fig.1C C Type of Gene Fold induction 2.967 2.615 2.534 2.375 2.322 2.245 2.158 2.091 2.040 2.012 CHI3L1 (Chitinase 3-like 1) PTX3 (Pentraxin 3) NNMT (Nicotinamide N-methyltransferase) ANXA1 (Annexin A1) CCL2 (Chemokine CC motif ligand 2) PBEF1 (pre B-cell colony enhancing factor 1) TIMP1 (Tissue inhibitor of metalloproteinase 1) PDPN (Podoplanin) LOX (Lysyl oxidase) IL13RA2 (Interleukin 13 receptor, alpha-2) Supplementary Figure 1. Relative mRNA expression levels of RRAD for glioma subtypes. (A) The lines indicate the mean with standard error. (B) Mean, minimum, percentiles and maximum values of RRAD expression in glioma subtypes. SD, standard deviation. (C) List of genes upregulated(> 2-fold) in High RRAD (36 cases), compared to Low RRAD (73 cases) glioma samples.