Download

1 / 23
230 likes | 233 Vues
This lesson explores dilations of the graph of the parent function y = |x|. Learn about translating, reflecting, and dilating graphs, and apply these concepts to absolute-value functions.

E N D
Dilations and the Absolute-Value Function Lesson 4.6
Hao and Dayita ride the subway to school each day. They live on the same east-west subway route. Hao lives 7.4 miles west of the school, and Dayita lives 5.2 miles east of the school. This information is shown on the number line below.
The distance between two points is always positive. However, if you calculate Hao’s distance from school, or HS, by subtracting his starting position from his ending position, you get a negative value: -7.4-0=-7.4
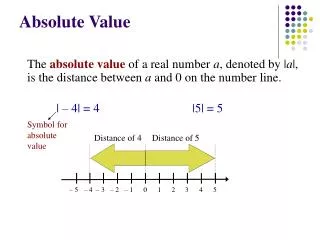
In order to make the distance positive, you use the absolute-value function, which gives the magnitude of a number, or its distance from zero on a number line. For example, the absolute value of 3 is 3, or |-3|=3. For Hao’s distance from school, you use the absolute-value function to calculate HS = |-7.4-0| =|-7.4| = 7.4
What is the distance from D to H? • What is the distance from H to D?
In this lesson you will explore transformations of the graph of the parent function y=|x|. • We will write and use equations in the form • What you have learned about translating and reflecting other graphs will apply to these functions as well. • You will also learn about transformations called dilations that stretch and shrink a graph.
You may have learned about dilations of geometric figures in an earlier course. • Now you will apply dilations to functions. If you dilate a figure by the same scale factor both vertically and horizontally, then the image and the original figure will be similar and perhaps congruent. If you dilate by different vertical and horizontal scale factors, then the image and the original figure will not be similar.
Example A • Graph the function y=|x| with each of these functions. How does the graph of each function compare to the original graph?
Example A • Graph the function y=|x| with each of these functions. How does the graph of each function compare to the original graph? Replacing y with y/2 pairs each x-value with twice the corresponding y-value in the parent function. The graph of y/2=|x| is a vertical stretch, or a vertical dilation, of the graph of y=|x| by a factor of 2.
Example A • Graph the function y=|x| with each of these functions. How does the graph of each function compare to the original graph? Replacing x with x/3 multiplies the x-coordinates by a factor of 3. The graph of y =|x/3| is a horizontal stretch, or a horizontal dilation, of the graph of y =|x| by a factor of 3.
Example A • Graph the function y=|x| with each of these functions. How does the graph of each function compare to the original graph? The combination of replacing y with y/2 and replacing x with x/3 results in a vertical dilation by a factor of 2 and a horizontal dilation by a factor of 3.
Translations and reflections are rigid transformations—they produce an image that is congruent to the original figure. Vertical and horizontal dilations are nonrigid transformations —the image is not congruent to the original figure (unless you use a factor of 1 or 1).
Example B • These data are from one bounce of a ball. Find an equation that fits the data over this domain.
The graph appears to be a parabola. • However, the parent function y=x2 has been reflected, translated, and dilated. • Start by determining the translations. The vertex has been translated from (0, 0) to (0.86, 0.60). • This is enough information for you to write the equation in the form y=(x-h)2+k, or y=(x-0.86)2 +0.60. • If you think of replacing x with (x-0.86) and replacing y with (y-0.60), you could also write the equivalent equation, y-0.6=(x-0.86)2.
The graph still needs to be reflected and dilated. • Select one other data point to determine the horizontal and vertical scale factors. You can use any point, but you will get a better fit if you choose one that is not too close to the vertex. For example, you can choose the data point(1.14, 0.18).
Assume this data point is the image of the point (1, 1) in the parent parabola y=x2. • In the graph of y=x2, (1, 1) is 1 unit away from the vertex (0, 0) both horizontally and vertically. The data point we chose in this graph, (1.14, 0.18), is 1.14-0.86, or 0.28, unit away from the x-coordinate of the vertex, and 0.18-0.60, or -0.42, unit away from the y-coordinate of the vertex.
So the horizontal scale factor is 0.28, and the vertical scale factor is -0.42. The negative vertical scale factor also produces a vertical reflection. • Combine these scale factors with the translations to get the final equation
Pendulum • Italian mathematician and astronomer Galileo Galilei (1564–1642) made many contributions to our understanding of gravity, the physics of falling objects, and the orbits of the planets. One of his famous experiments involved the periodic motion of a pendulum. In this investigation you will carry out the same experiment and find a function to model the data.
Procedural Note 1. Tie a weight at one end of a length of string to make a pendulum. Firmly hold the other end of the string, or tie it to something, so that the weight hangs freely. 2. Measure the length of the pendulum, from the center of the weight to the point where the string is held. 3. Pull the weight to one side and release it so that it swings back and forth in a short arc, about 10° to 20°. Time ten complete swings (forward and back is one swing). 4. The period of your pendulum is the time for one complete swing (forward and back). Find the period by dividing by 10.
Follow the Procedure Note to find the period of your pendulum. Repeat the experiment for several different string lengths and complete a table of values. Use a variety of short, medium, and long string lengths. • Graph the data using length as the independent variable. • What is the shape of the graph? • What do you suppose is the parent function?
The vertex is at the origin, (0, 0). Why do you suppose it is there? • Have each member of your group choose a different data point and use that data point to find the horizontal and vertical dilations. Apply these transformations to find an equation to fit the data. • Compare the collection of equations from your group. Which points are the best to use to fit the curve? Why do these points work better than others?
Dilation of a Function A dilation is a transformation that expands or compresses a graph either horizontally or vertically. Given the graph of y =f(x), the graph of y/b=f (x) or y=bf (x) is a vertical dilation by a factor of b. When |b|>1, it is a stretch; When 0<|b|<1, it is a shrink. When b<0 , a reflection across the x-axis also occurs. Given the graph of y=f(x), the graph of y=f(x/a) is a horizontal dilation by a factor of a. When |a|>1, it is a stretch; When 0<|a|<1, it is a shrink. When a<0, a reflection across the y-axis also occurs.