Download
1 / 6
60 likes | 130 Vues
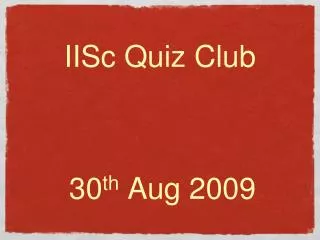
Aug. 4-6 th Dust Event. Dust. 2/00. 3/12. 1/12. Darfur Highlands. 4/00. 2/12. 3/00.

E N D
Dust 2/00 3/12 1/12 Darfur Highlands 4/00 2/12 3/00
The “cloud streak” begins on Aug. 1 at 1200 UTC over the Darfur highlands but is not associated with any significant AEW. The average speed of this streak is 12.7 m/s typical of these features and faster than AEWs. Three segments can be seen in this track associated with convection forming in the afternoon dying out then reforming on the gust front the next afternoon. The last segment has the strongest rain rates and is able to trigger a long-lived PV disturbance and at this longitude the disturbance is able to interact with the low-level baroclinicity. Note this Hovmöller uses all times. MCS AEW
Note this Hovmöller only uses 0600 data. Southerly winds begin on the 3rd and move at roughly the same speed as the AEW on the 4th-6th with an increase in westward motion between the 5th and 6th. It’s difficult to distinguish when the southerly flow stops being associated with the MCS and becomes associated with the NV but the phase speed of the red “southerly streak” (red line) is about 5 m/s more typical of AEWs.
Same as previous slide but for all times. Not much to add but one can see the impact of the diurnal cycle on low-level winds.
This hovmoller uses daily averaged values centered at 12 UTC. In contours is the low-level winds. Shaded is the aerosol extinction optical depth at 500 nm from the Aura OMI instrument. Note the lagged coupling between the winds and dust and specifically the slow propagation (~5m/s) of this event.