Download
1 / 8
80 likes | 248 Vues
Quantifying Rates of Soil Water Evaporation: Implementing a Soil Water Oxygen Isotope Model in Matlab. Erik Oerter EPS 209 27 April 2011. Project Motivation: Soil Water Oxygen Isotopes. Soil Water originates as meteoric water, preserving the isotopic signature of precipitation

E N D
Quantifying Rates of Soil Water Evaporation: Implementing a Soil Water Oxygen Isotope Model in Matlab Erik Oerter EPS 209 27 April 2011
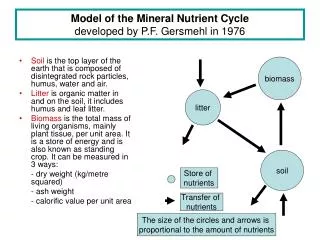
Project Motivation: Soil Water Oxygen Isotopes Soil Water originates as meteoric water, preserving the isotopic signature of precipitation Hydrogen and Oxygen isotopes undergo Rayleigh fractionation as water evaporates • Enrichment in 18O relative to precipitation The 18O/16O can be sampled: Directly as soil water (contemporary water) Indirectly as CaCO3 (ancient water) Use 18O/16O to estimate evaporation rate Climate Proxy
Evaporation Rate via Soil Water Oxygen Isotopes Evap. Rate Depth in soil profile 18O/16O of water at depth 18O/16O of water at “z” in soil profile 18O/16O of water at evap. front Diff coef. of water in soil Depth of evap. front L = Total depth of soil profile (Barnes and Allison, 1988, J. of Hydrology)
Project Idea: Fit modeled Oxygen isotope profile to observed data and find the evaporation rate Observed 18O profile Model 18O profile Data from Wang et al., 1996
Project Approach: m-file Sequence of Events Load in observed data as text file Initialize variables - Make an initial guess for evaporation rate - Populate a vector with evap guesses (~100) Specify the step between evap guesses - Initialize a matrix for calculated 18O profiles (# depth increments x # evap guesses) Loop over all evap guesses, calculating 18O profiles - Now have 100 18O profiles…
Project Approach: m-file Sequence of Events Compare the model 18O profiles to the observed data using a Chi square measure: Plot vsEvap guesses - Find the minimum 6) Display the best fit Evap guess
Some Results Diffusion Coefficient of Water in Soil = 1.5*10-10 m2/sec Starting Evap Rate Guess = 5x10-11 m/sec (0.15 cm/year) E guess step = 1*10-12 m/sec Best fit Evap rate = 1.02*10-10 m/sec (0.32 cm/year)
Future Work This interpretation of the Barnes and Allison Model: - Single wet soil zone with the evaporating front at the surface Barnes and Allison envisioned a dry zone of soil overlying the wet zone and evaporating front at some depth Implement the two zone scheme • - Allow for a migrating (+/- depth) evaporation front • Allow for resetting of the 18O input value • (Allow it to rain on the soil)