1 / 0

Chapter 10 Measuring the Stars

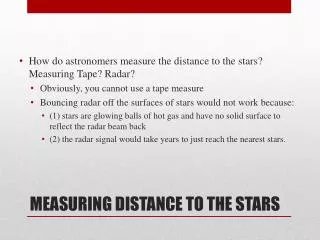
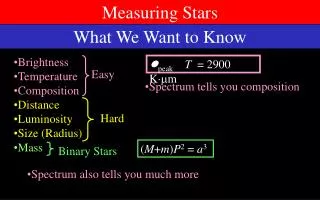
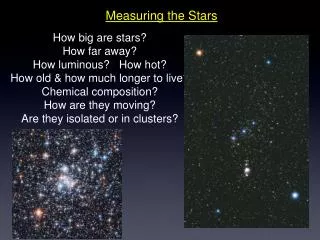
Chapter 10 Measuring the Stars. Chapter 10 Measuring the Stars. Units of Chapter 10. The Solar Neighborhood Luminosity and Apparent Brightness Stellar Temperatures Stellar Sizes The Hertzsprung–Russell Diagram Extending the Cosmic Distance Scale Stellar Masses. Question 1.

warner
Télécharger la présentation

Chapter 10 Measuring the Stars

An Image/Link below is provided (as is) to download presentation Download Policy: Content on the Website is provided to you AS IS for your information and personal use and may not be sold / licensed / shared on other websites without getting consent from its author. Content is provided to you AS IS for your information and personal use only. Download presentation by click this link. While downloading, if for some reason you are not able to download a presentation, the publisher may have deleted the file from their server. During download, if you can't get a presentation, the file might be deleted by the publisher.

E N D

Presentation Transcript


  1. Chapter 10Measuring the Stars

  2. Chapter 10Measuring the Stars
  3. Units of Chapter 10 The Solar Neighborhood Luminosity and Apparent Brightness Stellar Temperatures Stellar Sizes The Hertzsprung–Russell Diagram Extending the Cosmic Distance Scale Stellar Masses
  4. Question 1 a) sizes of stars. b) distances of stars. c) temperatures of stars. d) radial velocity of stars. e) brightness of stars. Stellar parallax is used to measure the
  5. Question 1 a) sizes of stars. b) distances of stars. c) temperatures of stars. d) radial velocity of stars. e) brightness of stars. Stellar parallax is used to measure the Parallax can be used to measure distances to stars accurately to about 200 parsecs (650 light-years).
  6. The Solar Neighborhood Parallax: Look at apparent motion of object against distant background from two vantage points; knowing baseline allows calculation of distance: distance (in parsecs) = 1/parallax (in arc seconds) 1 parsec ~ 3.3 ly
  7. Parallax Exaggeration Arc sec of movement Distance in parsecs
  8. Question 2 The angle of stellar parallax for a star gets larger as the a) distance to the star increases. b) size of the star increases. c) size of the telescope increases. d) length of the baseline increases. e) wavelength of light increases.
  9. Question 2 The angle of stellar parallax for a star gets larger as the a) distance to the star increases. b) size of the star increases. c) size of the telescope increases. d) length of the baseline increases. e) wavelength of light increases. Astronomers typically make observations of nearby stars 6 months apart, making the baseline distance equal to 2 AU (Astronomical Units).
  10. The Solar Neighborhood Nearest star to the Sun: Proxima Centauri, which is a member of a 3-star system: Alpha Centauri complex 1.3 parsecs or 0.77” of parallax (1/0.77=1.3) 4.3 ly Model of distances: Sun is a golf ball, Earth is a grain of sand orbiting 1 meter away. Solar system extends about 50 m from the Sun; rest of distance to nearest star is basically empty.
  11. Question 3 a) a tennis ball here, and one on the Moon. b) two beach balls separated by 100 city blocks. c) two grains of sand 100 light-years apart. d) two golf balls 270 km apart. e) two baseballs 100 yards apart. You can best model the size and distance relationship of our Sun & the next nearest star using
  12. Question 3 a) a tennis ball here, and one on the Moon. b) two beach balls separated by 100 city blocks. c) two grains of sand 100 light- years apart. d) two golf balls 270 km apart. e) two baseballs 100 yards apart. You can best model the size and distance relationship of our Sun & the next nearest star using The Sun is about one million miles in diameter. The next nearest star is about 25 million times farther away.
  13. The Solar Neighborhood The 30 closest stars to the Sun
  14. Question 4 a) true motion in space. b) apparent shift as we view from opposite sides of Earth’s orbit every six months. c) annual apparent motion across the sky. d) motion toward or away from us, revealed by Doppler shifts. e) orbital motion around the galaxy. A star’s proper motion is its
  15. Question 4 a) true motion in space. b) apparent shift as we view from opposite sides of Earth’s orbit every six months. c) annual apparent motion across the sky. d) motion toward or away from us, revealed by Doppler shifts. e) orbital motion around the galaxy. A star’s proper motion is its A star’s “real space motion” combines its apparent propermotion with its radial motion toward or away from Earth.
  16. The Solar Neighborhood Barnard’s Star (top) has the largest proper motion of any – proper motion is the actual shift of the star in the sky, after correcting for parallax. The pictures (a) were taken 22 years apart. (b) shows the actual motion of the Alpha Centauri complex.
  17. Luminosity and Apparent Brightness Luminosity, or absolute brightness, is a measure of the total power radiated by a star. Apparent brightness is how bright a star appears when viewed from Earth; it depends on the absolute brightness but also on the distance of the star: apparent brightness  luminosity/distance2
  18. Luminosity and Apparent Brightness This is an example of an inverse square law.
  19. Luminosity and Apparent Brightness Therefore, two stars that appear equally bright might be a closer, dimmer star and a farther, brighter one.
  20. Question 5 In the stellar magnitude system invented by Hipparchus, a smaller magnitude indicates a _____ star. a) brighter b) hotter c) cooler d) fainter e) more distant
  21. Question 5 In the stellar magnitude system invented by Hipparchus, a smaller magnitude indicates a _____ star. a) brighter b) hotter c) cooler d) fainter e) more distant
  22. Luminosity and Apparent Brightness Apparent luminosity is measured using a magnitude scale, which is related to our perception. It is a logarithmic scale; a change of 5 in magnitude corresponds to a change of a factor of 100 in apparent brightness. It is also inverted – larger magnitudes are dimmer.
  23. Magnitude 5 to 30 5 to 10 = 100 times dimmer 10 to 15 = 100 x 100 = 10,000 15 to 20 = 100 x 10,000 = 1,000,000 20 to 25 = 100 x 1,000,000 = 100,000,000 30 = 100 x 100,000,000 = 10,000,000,000 times dimmer than magnitude 5
  24. Question 6 a) distance. b) temperature. c) brightness. d) absolute luminosity. e) radial velocity. A star’s apparent magnitude is a number used to describe how our eyes measure its
  25. Question 6 a) distance. b) temperature. c) brightness. d) absolute luminosity. e) radial velocity. A star’s apparent magnitude is a number used to describe how our eyes measure its
  26. Question 7 a) one million km. b) one Astronomical Unit. c) one light-year. d) ten parsecs. e) ten light-years. The absolute magnitude of a star is its brightness as seen from a distance of
  27. Question 7 a) one million km. b) one Astronomical Unit. c) one light-year. d) ten parsecs. e) ten light-years. The absolute magnitude of a star is its brightness as seen from a distance of Astronomers use a distance of 10 parsecs (about 32 light-years) as a standard for specifying and comparing the brightnesses of stars.
  28. Stellar Temperatures The color of a star is indicative of its temperature. Red stars are relatively cool, whereas blue ones are hotter.
  29. Stellar Temperatures The radiation from stars is blackbody radiation; as the blackbody curve is not symmetric, observations at two wavelengths are enough to define the temperature.
  30. Question 8 a) longer b) more green c) heavier d) shorter e) more constant Wien’s law tells us that the hotter an object, the _____ the peak wavelength of its emitted light.
  31. Question 8 a) longer b) more green c) heavier d) shorter e) more constant Wien’s law tells us that the hotter an object, the _____ the peak wavelength of its emitted light. Wien’s law states that hotter stars appear more blue in color, and cooler stars appear more red in color.
  32. Stellar Temperatures Stellar spectra are much more informative than the blackbody curves. There are seven general categories of stellar spectra, corresponding to different temperatures. From highest to lowest, those categories are: O B A F G K M
  33. Question 9 a) its color. b) the pattern of absorption lines in its spectrum. c) Wien’s law. d) differences in brightness as measured through red and blue filters. e) All of the above are used. We estimate the surface temperature of a star by using
  34. Question 9 a) its color. b) the pattern of absorption lines in its spectrum. c) Wien’s law. d) differences in brightness as measured through red and blue filters. e) All of the above are used. We estimate the surface temperature of a star by using
  35. Stellar Temperatures The seven spectral types Emission
  36. Question 10 a) O b) A c) F d) G e) M Which spectral classification type corresponds to a star like the Sun?
  37. Question 10 a) O b) A c) F d) G e) M Which spectral classification type corresponds to a star like the Sun? The OBAFGKM classification scheme is based on absorption lines.
  38. Question 11 a) B stars show strong hydrogen lines; G stars show weaker hydrogen lines. b) B stars show few metal lines; G stars show many. c) B stars have no metal atoms. d) G stars have no hydrogen atoms. e) Both a and b are true. The key difference between the spectra of B stars and G stars is
  39. Question 11 a) B stars show strong hydrogen lines; G stars show weaker hydrogen lines. b) B stars show few metal lines; G stars show many. c) B stars have no metal atoms. d) G stars have no hydrogen atoms. e) Both a and b are true. The key difference between the spectra of B stars and G stars is The original OBAFGKM sequence was arranged alphabetically by the strength of hydrogen absorption lines. B stars had strong hydrogen lines, G stars had weak lines.
  40. Stellar Temperatures The different spectral classes have distinctive absorption lines.
  41. Question 12 What are the two most important intrinsic properties for classifying stars? a) distance and surface temperature b) luminosity and surface temperature c) distance and luminosity d) mass and age e) distance and color
  42. Question 12 What are the two most important intrinsic properties for classifying stars? a) distance and surface temperature b) luminosity and surface temperature c) distance and luminosity d) mass and age e) distance and color The H–R diagram plots stars based on their luminosities and surface temperatures.
  43. Stellar Sizes A few very large, very close stars can be imaged directly; this is Betelgeuse.
  44. Stellar Sizes For the vast majority of stars that cannot be imaged directly, size must be calculated knowing the luminosity and temperature: luminosityradius2temperature4 Giant stars have radii between 10 and 100 times the Sun’s. Dwarf stars have radii equal to, or less than, the Sun’s. Supergiant stars have radii more than 100 times the Sun’s.
  45. Stellar Sizes Stellar radii vary widely.
  46. Question 13 a) apparent brightness. b) direct observation of diameter. c) temperature. d) distance to the star. e) a, b, and c are all true. Astronomers can estimate the size of a star using
  47. Question 13 a) apparent brightness. b) direct observation of diameter. c) temperature. d) distance to the star. e) a, b, and c are all true. Astronomers can estimate the size of a star using Brightness and temperature are used to plot the star on an H–R diagram, and indicate its approximate size. Some stars are large enough to measure directly.
  48. The Hertzsprung–Russell Diagram The H–R diagram plots stellar luminosity against surface temperature. This is an H–R diagram of a few prominent stars.
  49. The Hertzsprung–Russell Diagram Once many stars are plotted on an H–R diagram, a pattern begins to form: These are the 80 closest stars to us; note the dashed lines of constant radius. The darkened curve is called the main sequence, as this is where most stars are. Also indicated is the white dwarf region; these stars are hot but not very luminous, as they are quite small.
  50. The Hertzsprung–Russell Diagram An H–R diagram of the 100 brightest stars looks quite different. These stars are all more luminous than the Sun. Two new categories appear here – the red giants and the blue giants. Clearly, the brightest stars in the sky appear bright because of their enormous luminosities, not their proximity.
  51. Compare Near to Bright Near Bright
  52. The Hertzsprung–Russell Diagram This is an H–R plot of about 20,000 stars. The main sequence is clear, as is the red giant region. About 90 percent of stars lie on the main sequence; 9 percent are red giants and 1 percent are white dwarfs.
  53. H-R Diagram
  54. Extending the Cosmic Distance Scale Spectroscopic parallax: Has nothing to do with parallax, but does use spectroscopy in finding the distance to a star. Measure the star’s apparent magnitude and spectral class. Use spectral class to estimate luminosity. Apply inverse-square law to find distance.
  55. Extending the Cosmic Distance Scale Spectroscopic parallax can extend the cosmic distance scale to several thousand parsecs. Andromeda Sun
  56. Extending the Cosmic Distance Scale The spectroscopic parallax calculation can be misleading if the star is not on the main sequence. The width of spectral lines can be used to define luminosity classes.
  57. Extending the Cosmic Distance Scale In this way, giants and supergiants can be distinguished from main-sequence stars.
  58. Question 14 a) ages of stars. b) absolute luminosities of stars. c) masses of stars. d) distances to stars. e) rotation rates of stars. Eclipsing binary stars are very useful for determining the
  59. Question 14 a) ages of stars. b) absolute luminosities of stars. c) masses of stars. d) distances to stars. e) rotation rates of stars. Eclipsing binary stars are very useful for determining the Analysis of the light curve of an eclipsing binary star system can reveal the masses of the stars.
  60. Stellar Masses Many stars are in binary pairs; measurement of their orbital motion allows determination of the masses of the stars. Orbits of visual binaries can be observed directly; Doppler shifts in spectroscopic binaries allow measurement of motion; and the period of eclipsing binaries can be measured using intensity variations.
  61. Stellar Masses Mass is the main determinant of where a star will be on the main sequence.
  62. Stellar Masses Stellar mass distributions – there are many more small stars than large ones!
  63. Question 15 What is the single most important characteristic in determining the course of a star’s evolution? a) density b) absolute brightness c) distance d) surface temperature e) mass
  64. Question 15 What is the single most important characteristic in determining the course of a star’s evolution? a) density b) absolute brightness c) distance d) surface temperature e) mass A star’s mass determines how fast it forms, its luminosity on the main sequence, how long it will shine, and its ultimate fate.
  65. Lifetime of a Star A redwood tree might live 2000 years. How would we ever know what it looked like at 1 year or 10 years or 100years? We do the same thing with stars. This is millions to trillions of years for stars depending on the type.
  66. Summary of Chapter 10 Distance to nearest stars can be measured by parallax. Apparent brightness is as observed from Earth; depends on distance and absolute luminosity. Spectral classes correspond to different surface temperatures. Stellar size is related to luminosity and temperature.
  67. Summary of Chapter 10, cont. H–R diagram is plot of luminosity vs. temperature; most stars lie on main sequence. Distance ladder can be extended using spectroscopic parallax. Masses of stars in binary systems can be measured. Mass determines where star lies on main sequence.
More Related