Download
1 / 44
440 likes | 484 Vues
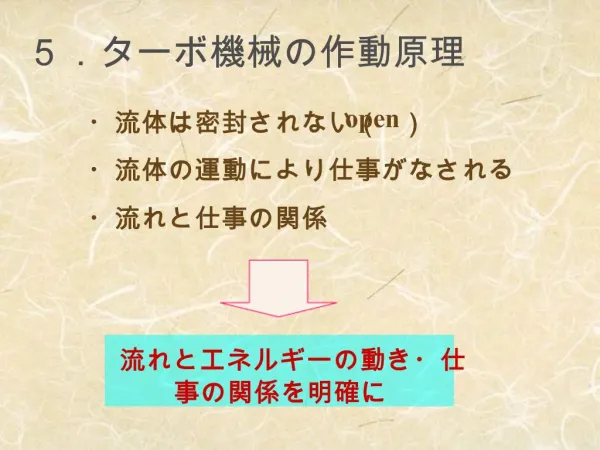
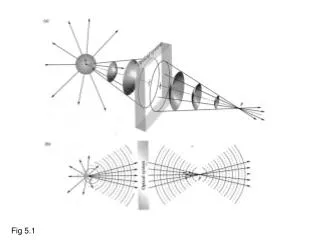
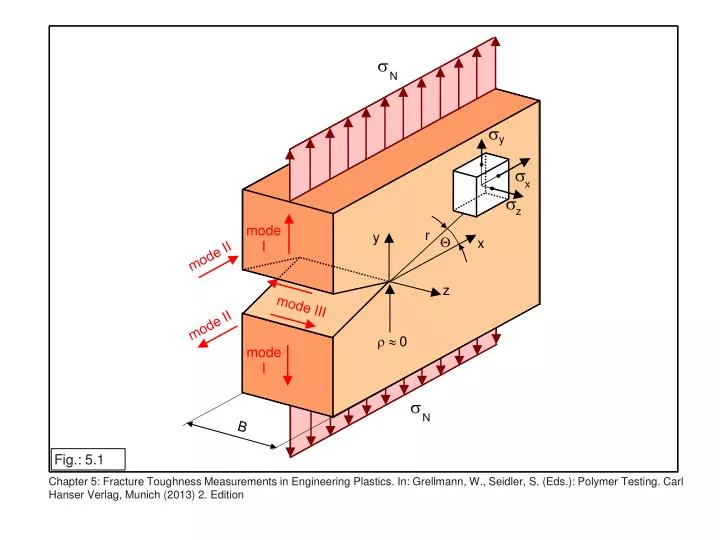
s. N. s. y. s. x. s. z. mode I. r. y. . x. mode II. z. mode III. mode II. r » 0. mode I. s. N. B. Fig.: 5.1.

E N D
s N s y s x s z mode I r y x mode II z mode III mode II r » 0 mode I s N B Fig.: 5.1 Chapter 5: Fracture Toughness Measurements in Engineering Plastics. In: Grellmann, W., Seidler, S. (Eds.): Polymer Testing. Carl Hanser Verlag, Munich (2013) 2. Edition
SENB specimen (single-edge-notched bend specimen) F W = 10 mm B = 2 … 10 mm L = 80 mm s = 40 … 70 mm a = 0.5 … 7.5 mm N = 2 mm W a F/2 F/2 N s L/2 L/2 a F s K = f I 3/2 W B W 9 7 1 5 3 a a a a a a 2 2 2 2 2 f = 2.9 − 4.6 + 21.8 − 37.6 + 38.7 W W W W W W 2 a a a a 1.99 − 1 − 2.15 − 3.93 + 2.7 W W W a W 3 a f = 3 W 2 W a a 2 1− 1+2 W W Fig.: 5.2a Chapter 5: Fracture Toughness Measurements in Engineering Plastics. In: Grellmann, W., Seidler, S. (Eds.): Polymer Testing. Carl Hanser Verlag, Munich (2013) 2. Edition
SENT specimen (single-edge-notched tension specimen) W = 40 mm H = 150 mm s = 120 mm D = 10 mm a = 18 … 22 mm N = 3 mm B = 2 … 10 mm F W/2 H/2 W s a N H/2 O D 1/2 a F a K = f I W B W F 4 2 3 a a a a a f = 1.99 − 0.41 + 18.7 − 38.48 + 53.85 W W W W W Fig.: 5.2b Chapter 5: Fracture Toughness Measurements in Engineering Plastics. In: Grellmann, W., Seidler, S. (Eds.): Polymer Testing. Carl Hanser Verlag, Munich (2013) 2. Edition
CT specimen (compact tension specimen) F W = 40 mm H = 48 mm G = 50 mm s = 22 mm D = 10 mm a = 18 … 22 mm N = 2 mm B = 2 … 34 mm l = 1.5 mm H/2 l s O D N H/2 a W F G a F K = f I 1/2 W B W 9 1 3 7 5 a a a a a a 2 2 2 2 2 f = 29.6 − 185.5 + 655.7 − 1017 + 638.9 W W W W W W Fig.: 5.2c Chapter 5: Fracture Toughness Measurements in Engineering Plastics. In: Grellmann, W., Seidler, S. (Eds.): Polymer Testing. Carl Hanser Verlag, Munich (2013) 2. Edition
b 260 K a 240 c 1/2 240 K Ic 210 220 K ; K (MPamm ) 180 SENT 1/2 200 Ic 150 B EDZ min c K ; K (MPamm ) 180 120 B ESZ/EDZ Ic 160 90 10 20 30 0 c K c B (mm) 140 60 K Ic 120 B CT min 100 0 2 4 6 8 1 0 B (mm) B ( m m ) Fig.: 5.3
a residual fracture area b damage area stable crack growth (fracture mirror length) machined notch (razor blade notch) 100 µm B Fig.: 5.4 Chapter 5: Fracture Toughness Measurements in Engineering Plastics. In: Grellmann, W., Seidler, S. (Eds.): Polymer Testing. Carl Hanser Verlag, Munich (2013) 2. Edition
s y s y d x r a pl s Fig.: 5.5 Chapter 5: Fracture Toughness Measurements in Engineering Plastics. In: Grellmann, W., Seidler, S. (Eds.): Polymer Testing. Carl Hanser Verlag, Munich (2013) 2. Edition
a b 200 µm 50 µm Fig.: 5.6 Chapter 5: Fracture Toughness Measurements in Engineering Plastics. In: Grellmann, W., Seidler, S. (Eds.): Polymer Testing. Carl Hanser Verlag, Munich (2013) 2. Edition
s/2 d/2 2 3 (W a) W 1 1 n max f 1 hinge point 2 sharp notch 3 support Fig.: 5.7 Chapter 5: Fracture Toughness Measurements in Engineering Plastics. In: Grellmann, W., Seidler, S. (Eds.): Polymer Testing. Carl Hanser Verlag, Munich (2013) 2. Edition
y 2 s/2 1 d SZH d/2 x SZH 3 100 µm SZW a stable crack growth 5 µm b stretch zone brittle fracture initial crack SZW 10 µm SZH c d Fig.: 5.8 Chapter 5: Fracture Toughness Measurements in Engineering Plastics. In: Grellmann, W., Seidler, S. (Eds.): Polymer Testing. Carl Hanser Verlag, Munich (2013) 2. Edition
T y n a b I dR 1 a 1 I 2 a F 2 I Riss 3 a crack 3 x 1 2 A R G f (i=1...3) i f resp. v c d J Ic I I I 1 2 3 J A I G B f 3 a ¶A f 1 1 G 2 f ¶a B a a 1 3 2 a f resp. v Fig.: 5.9 Chapter 5: Fracture Toughness Measurements in Engineering Plastics. In: Grellmann, W., Seidler, S. (Eds.): Polymer Testing. Carl Hanser Verlag, Munich (2013) 2. Edition
loading parameter blunting Line J; d technical crack initiation J ; d 0.2 0.2 resistance against crack propagation crack propagation physical crack initiation resistance against crack initiation crack initiation J ; d i i crack blunting Da Da = 0.2 mm SZW stable crack growth Da Fig.: 5.10 Chapter 5: Fracture Toughness Measurements in Engineering Plastics. In: Grellmann, W., Seidler, S. (Eds.): Polymer Testing. Carl Hanser Verlag, Munich (2013) 2. Edition
junction diode laser collecting lens F deflection mirror CT specimen start v F semiconductor prism motor t stop evaluation and graphics rotating mirror Fig.: 5.11 Chapter 5: Fracture Toughness Measurements in Engineering Plastics. In: Grellmann, W., Seidler, S. (Eds.): Polymer Testing. Carl Hanser Verlag, Munich (2013) 2. Edition
type II type I 5 % 5 % F max T T F max F F Q Q F F S S a v v c c v; v ; f v; v ; f L L Fig.: 5.12 Chapter 5: Fracture Toughness Measurements in Engineering Plastics. In: Grellmann, W., Seidler, S. (Eds.): Polymer Testing. Carl Hanser Verlag, Munich (2013) 2. Edition
crack initiation crack propagation 5 4 b c crack blunting 3 200 µm 1 mm 2 a 1 50 µm 0 0 1 2 3 4 5 -2 F/(B(W−a )) (Nmm ) f (mm) eff Fig.: 5.13 Chapter 5: Fracture Toughness Measurements in Engineering Plastics. In: Grellmann, W., Seidler, S. (Eds.): Polymer Testing. Carl Hanser Verlag, Munich (2013) 2. Edition
unnotched specimen notched specimen F F max max F (N) F (N) A A G 0 v ; f v ; f 0 L0 max Lmax v ; f (mm) v ; f (mm) L L Fig.: 5.14 Chapter 5: Fracture Toughness Measurements in Engineering Plastics. In: Grellmann, W., Seidler, S. (Eds.): Polymer Testing. Carl Hanser Verlag, Munich (2013) 2. Edition
load–deflection diagram Charpy impact tester ICIT-4J AG = Apl + Ael Fmax striker load (F) - transducer Fgy load F (N) t specimen F1 Apl AR personal computer tB ; fmax fgy time resp. deflection (ms; mm) analysis of F–f diagram amplifier digital oscilloscope - checking of experimental conditions tB > 3t F1 < Fmax AH > 3 AG - SEM analysis of fracture surface - fracture mechanics concept support - checking of geometry - independence of fracture mechanics values photooptical transducer deflection (f) - sensor KId ; dId ; JId Fig.: 5.15 Chapter 5: Fracture Toughness Measurements in Engineering Plastics. In: Grellmann, W., Seidler, S. (Eds.): Polymer Testing. Carl Hanser Verlag, Munich (2013) 2. Edition
Fmax II I III Fmax Fmax Fgy FF AG = Apl + Ael Fgy Apl F AG Ael AG fgy fmax fmax fmax fgy Fmax Ia IIa IIIa Fmax Fmax Fgy FF Fgy Apl AR AG AR AG Ael AR fmax fmax fmax fgy fgy f Fig.: 5.16 Chapter 5: Fracture Toughness Measurements in Engineering Plastics. In: Grellmann, W., Seidler, S. (Eds.): Polymer Testing. Carl Hanser Verlag, Munich (2013) 2. Edition
a/W = 0.45 a/W = 0.2 F = 53 N max -1 F = 36 N F = 36 N 1 1 F = 28 N v = 2.9 ms max I F = 62 N max -1 F = 36 N max v = 1 ms I F = 8 N F = 8 N 1 1 Fig.: 5.17 Chapter 5: Fracture Toughness Measurements in Engineering Plastics. In: Grellmann, W., Seidler, S. (Eds.): Polymer Testing. Carl Hanser Verlag, Munich (2013) 2. Edition
F A W a s L B B B 0.05 < a/W < 0.15 0.1 < a/W < 0.4 0.3 < a/W < 0.7 Fig.: 5.18 Chapter 5: Fracture Toughness Measurements in Engineering Plastics. In: Grellmann, W., Seidler, S. (Eds.): Polymer Testing. Carl Hanser Verlag, Munich (2013) 2. Edition
3.0 PVCC BL J 2.5 -1 FEM J v = 1.5 ms I s/W = 4 RT 2.0 J-integral ratio MC J 1.5 FEM J 1.0 ST J FEM J 0.5 RPM J FEM J 0 0 0.2 0.4 0.6 0.8 Fig.: 5.19 a/W Chapter 5: Fracture Toughness Measurements in Engineering Plastics. In: Grellmann, W., Seidler, S. (Eds.): Polymer Testing. Carl Hanser Verlag, Munich (2013) 2. Edition
100 -1.73 b = 3466 K I 10 b 1 0.1 100 1000 10 1/2 K ; K (MPamm ) Id Ic Fig.: 5.20 Chapter 5: Fracture Toughness Measurements in Engineering Plastics. In: Grellmann, W., Seidler, S. (Eds.): Polymer Testing. Carl Hanser Verlag, Munich (2013) 2. Edition
10000 -0.94 e = 224 J I 1000 e 100 10 1 1 10 100 0.1 -1 J ; J (Nmm ) Id Ic Fig.: 5.21 Chapter 5: Fracture Toughness Measurements in Engineering Plastics. In: Grellmann, W., Seidler, S. (Eds.): Polymer Testing. Carl Hanser Verlag, Munich (2013) 2. Edition
100 -0.83 = 3.6 d Idk 10 0.1 1 0.01 d [mm] Idk Fig.: 5.22 Chapter 5: Fracture Toughness Measurements in Engineering Plastics. In: Grellmann, W., Seidler, S. (Eds.): Polymer Testing. Carl Hanser Verlag, Munich (2013) 2. Edition
spring F acceleration unit drop weigth strain gauge lifting device clamped test sheet cross-head masses controller instrumented drop weigth support temperature chamber Fig.: 5.23 Chapter 5: Fracture Toughness Measurements in Engineering Plastics. In: Grellmann, W., Seidler, S. (Eds.): Polymer Testing. Carl Hanser Verlag, Munich (2013) 2. Edition
PA 6 + impact modifier 25 0 wt.-% 5 wt.-% 10 wt.-% 20 wt.-% 25 wt.-% 20 15 10 5 0 70 90 10 30 -30 50 -70 -50 -10 T (°C) ST J (Nmm-1) d Fig.: 5.24 Chapter 5: Fracture Toughness Measurements in Engineering Plastics. In: Grellmann, W., Seidler, S. (Eds.): Polymer Testing. Carl Hanser Verlag, Munich (2013) 2. Edition
7 6 5 4 PVC/chalk 3 PP/chalk PVC/SiO 2 2 PE/SiO 2 PE/BW 1 PE/HP 0 0.3 0.1 0.2 0.4 0 j v ST J (Nmm-1) d Fig.: 5.25 Chapter 5: Fracture Toughness Measurements in Engineering Plastics. In: Grellmann, W., Seidler, S. (Eds.): Polymer Testing. Carl Hanser Verlag, Munich (2013) 2. Edition
a b 2.0 500 1.8 450 1.6 400 1.4 350 1.2 300 f (mm) F (N) max 1.0 PVC/chalk max 250 PP/chalk 0.8 200 PVC/SiO 2 0.6 PE/SiO 2 150 PE/BW 0.4 PE/HP 100 0.2 0.3 0.3 0.1 0.1 0.2 0.2 0.4 0.4 0 0 50 j j 0 v v Fig.: 5.26 Chapter 5: Fracture Toughness Measurements in Engineering Plastics. In: Grellmann, W., Seidler, S. (Eds.): Polymer Testing. Carl Hanser Verlag, Munich (2013) 2. Edition
1.6 stearic acid surfactant 1.4 = 0.9 = 1.5 a b 1.2 1.0 5 µm 2 µm 0.8 0 0.25 0.50 0.75 1.00 1.25 1.50 coupling agent content (wt.-%) M ST J /J Id Fig.: 5.27 Chapter 5: Fracture Toughness Measurements in Engineering Plastics. In: Grellmann, W., Seidler, S. (Eds.): Polymer Testing. Carl Hanser Verlag, Munich (2013) 2. Edition
110 PVC P V C 100 j PVC + chalk (j = 0.17) P V C + K r e i d e ( = 0 , 1 7 ) v v 90 d (10-3 mm) 80 Id 70 60 50 40 30 20 -150 -100 -50 0 50 1 2 3 1 7 3 2 2 3 2 7 3 3 2 3 T (°C) T ( K ) Fig.: 5.28 Chapter 5: Fracture Toughness Measurements in Engineering Plastics. In: Grellmann, W., Seidler, S. (Eds.): Polymer Testing. Carl Hanser Verlag, Munich (2013) 2. Edition
b a 450 0.45 400 0.40 350 f (mm) F (N) max max 300 0.35 250 0.30 200 0 0.1 0.2 0.3 0 0.1 0.2 0.3 j j v v 5 c d 210 K (a ) ld eff 4 180 1/2 -1 150 J (Nmm ) K (MPamm ) 3 K (a ) ld 0 Id 120 Id 2 90 1 60 0 0.1 0.2 0.3 0 0.1 0.2 0.3 j j Fig.: 5.29 v v Chapter 5: Fracture Toughness Measurements in Engineering Plastics. In: Grellmann, W., Seidler, S. (Eds.): Polymer Testing. Carl Hanser Verlag, Munich (2013) 2. Edition
2.5 2.0 PP/GF 1.5 Id M PE/GF J /J Id 1.0 0.5 ; experiment model 0 0 0.3 0.1 0.2 j v Fig.: 5.30 Chapter 5: Fracture Toughness Measurements in Engineering Plastics. In: Grellmann, W., Seidler, S. (Eds.): Polymer Testing. Carl Hanser Verlag, Munich (2013) 2. Edition
F F G G 100 N M 100 N f A /A f A /A R 1.2 R M 0.8 mm 0.8 mm 1.0 100 µm 0.8 PP + glass-fiber 0.6 (j = 0.13) v 0.4 100 µm 0 0.25 0.50 0.75 1.00 coupling agent content (wt.-%) Fig.: 5.31 Chapter 5: Fracture Toughness Measurements in Engineering Plastics. In: Grellmann, W., Seidler, S. (Eds.): Polymer Testing. Carl Hanser Verlag, Munich (2013) 2. Edition
4 E/P copolymer + 10 wt.-% GF with 0.4 wt.-% CA 3 J (Nmm-1) 2 without CA 1 0 0.2 0.6 0.4 0 0.8 Da (mm) CA – coupling agent content Fig.: 5.32 Chapter 5: Fracture Toughness Measurements in Engineering Plastics. In: Grellmann, W., Seidler, S. (Eds.): Polymer Testing. Carl Hanser Verlag, Munich (2013) 2. Edition
; experiment ; model 100 80 with coupling agent -2 60 a (kJm ) cN without coupling agent 40 20 0 80 100 0 20 40 60 PE content (wt.-%) Fig.: 5.33 Chapter 5: Fracture Toughness Measurements in Engineering Plastics. In: Grellmann, W., Seidler, S. (Eds.): Polymer Testing. Carl Hanser Verlag, Munich (2013) 2. Edition
TPU/ABS blends Da Da 9 min max TPU/ABS 50/50 7 TPU/ABS 20/80 -1 J (Nmm ) 5 ABS 3 1 0 0.4 0.2 0.6 0.8 Da (mm) Fig.: 5.34 Chapter 5: Fracture Toughness Measurements in Engineering Plastics. In: Grellmann, W., Seidler, S. (Eds.): Polymer Testing. Carl Hanser Verlag, Munich (2013) 2. Edition
4 -1 3 T = 30 °C A 1.4 µm J (Nmm ) c 16 0.2 A = 2.00 µm 2 A = 1.45 µm A = 1.40 µm 12 1 A = 1.30 µm 2.0 1.0 1.5 A = 1.20 µm Da A (µm) min -1 J (Nmm ) 8 4 Da max 0 0.8 0.2 0.4 0.6 0 Da (mm) Fig.: 5.35 Chapter 5: Fracture Toughness Measurements in Engineering Plastics. In: Grellmann, W., Seidler, S. (Eds.): Polymer Testing. Carl Hanser Verlag, Munich (2013) 2. Edition
10 8 -1 A 0.4 µm 6 J (Nmm ) c T = 23 °C 4 30 0.2 2 Da max 0 0.6 0.9 1.2 0.3 A (µm) 20 A = 1.00 µm A = 0.57 µm -1 A = 0.54 µm J (Nmm ) A = 0.40 µm Da min A = 0.39 µm A = 0.36 µm 10 0 0.8 0.6 0 0.2 0.4 Da (mm) Fig.: 5.36 Chapter 5: Fracture Toughness Measurements in Engineering Plastics. In: Grellmann, W., Seidler, S. (Eds.): Polymer Testing. Carl Hanser Verlag, Munich (2013) 2. Edition
copolymer 1 (30 °C) 8 copolymer 2 (20 °C) -1 6 J (Nmm ) 7 4 0.2 2 6 0 3 1 2 4 0 5 A/D 4 brittle copolymer 1 3 tough 2 copolymer 2 1 high impact 0 20 -30 10 -20 -10 40 0 30 50 T (°C) (A/D) c Fig.: 5.37 Chapter 5: Fracture Toughness Measurements in Engineering Plastics. In: Grellmann, W., Seidler, S. (Eds.): Polymer Testing. Carl Hanser Verlag, Munich (2013) 2. Edition
energy - determined 100 80 high impact 60 j (wt.-%) tough EPR 40 20 brittle 0 -80 -60 0 -40 20 -20 40 T (°C) ST J J Id 0.2 Fig.: 5.38 Chapter 5: Fracture Toughness Measurements in Engineering Plastics. In: Grellmann, W., Seidler, S. (Eds.): Polymer Testing. Carl Hanser Verlag, Munich (2013) 2. Edition
175 composition 1 150 1/2 K (MPamm ) 125 Id 100 composition 2 75 0 10 30 20 40 50 t (min) w Fig.: 5.39 Chapter 5: Fracture Toughness Measurements in Engineering Plastics. In: Grellmann, W., Seidler, S. (Eds.): Polymer Testing. Carl Hanser Verlag, Munich (2013) 2. Edition
2 µm Fig.: 5.40 Chapter 5: Fracture Toughness Measurements in Engineering Plastics. In: Grellmann, W., Seidler, S. (Eds.): Polymer Testing. Carl Hanser Verlag, Munich (2013) 2. Edition
carbon black content (phr) 0 10 20 30 40 50 60 J (Nmm-1) d 200 carbon black 150 sulfur 100 50 0 1.0 1.5 2.0 2.5 sulfur content (phr) Fig.: 5.41 Chapter 5: Fracture Toughness Measurements in Engineering Plastics. In: Grellmann, W., Seidler, S. (Eds.): Polymer Testing. Carl Hanser Verlag, Munich (2013) 2. Edition
material selection dimensioning fracture behavior strength verification strain verification e >e e < e s <s s >s brittle tough undefined zul zul zul zul Charpy impact strength unsufficient sufficient demands on technology velocity- manufacturing monitoring temperature- realizable unrealizable shifting-concept unsufficient sufficient fracture mechanics concept realization K < K K > K I I zul I I zul or J > J J < J I I zul I I zul Fig.: 5.42 Chapter 5: Fracture Toughness Measurements in Engineering Plastics. In: Grellmann, W., Seidler, S. (Eds.): Polymer Testing. Carl Hanser Verlag, Munich (2013) 2. Edition