Download
1 / 16
160 likes | 168 Vues
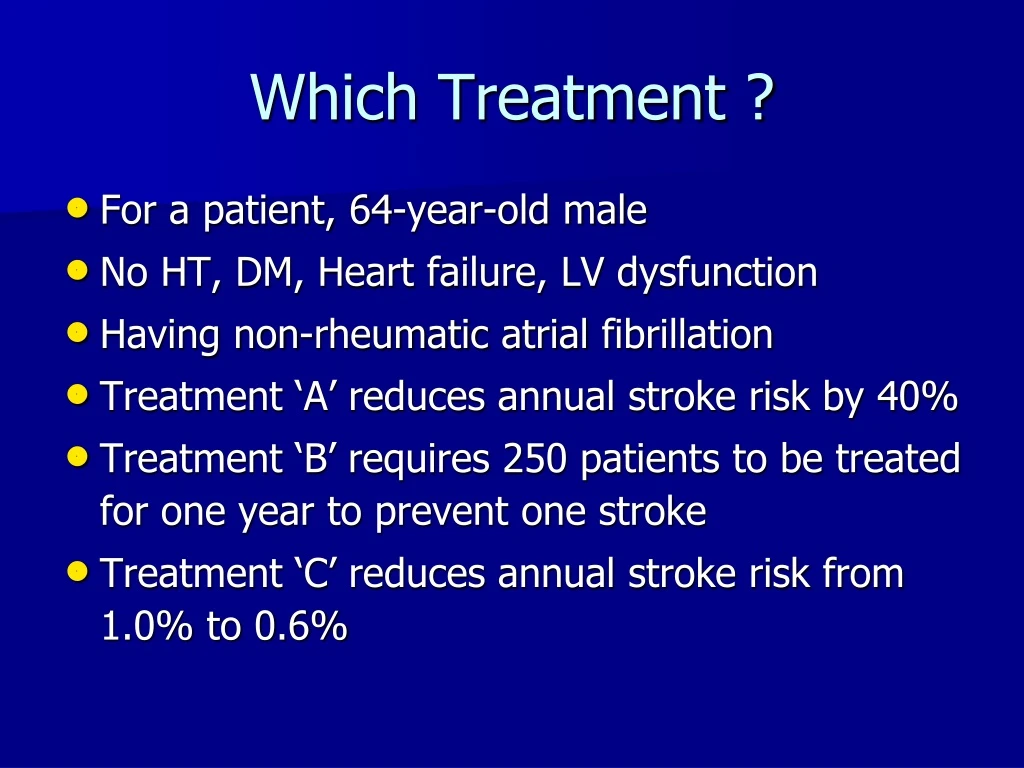
Which Treatment ?. For a patient, 64-year-old male No HT, DM, Heart failure, LV dysfunction Having non-rheumatic atrial fibrillation Treatment ‘A’ reduces annual stroke risk by 40% Treatment ‘B’ requires 250 patients to be treated for one year to prevent one stroke

E N D
Which Treatment ? • For a patient, 64-year-old male • No HT, DM, Heart failure, LV dysfunction • Having non-rheumatic atrial fibrillation • Treatment ‘A’ reduces annual stroke risk by 40% • Treatment ‘B’ requires 250 patients to be treated for one year to prevent one stroke • Treatment ‘C’ reduces annual stroke risk from 1.0% to 0.6%
Newspaper headlines: Economic reforms succeed • Economic reforms led to decline in unemployment from 20% to 15%, thus reducing it by 25%
Newspaper headlines: Economic reforms succeed • Economic reforms led to decline in unemployment from 20% to 15%, thus reducing it by 25%. • How? Difference is only 5%. • If 20% = 100% • Then 15% = 75% • And 5% = 25%
Absolute risk reduction Baseline risk Relative risk Relative risk reduction Different ways of expressing effects • Economic reforms led to decline in unemployment rate from 20% to 15%, thus reducing it by 25% • 20% - 15% = 5% • If 20% = 100% • Then 15% = 75% • And 5% = 25%
In an Intervention trial • Intervention led to decline in risk (incidence) of mortality from 20% (in control group) to 15% (in intervention group), thus reducing it by 25%. • Risk Difference is the simple difference between the two risks = 5%. • If 20% is taken as 100%, then • 15=75% = RR (15%/20%=0.75=75%) • And 5% = 25% i.e. RRR (100-75 i.e. 100-RR (%) or in decimals, 1 - RR
What does risk difference of 5% mean? • 5 per cent = 5 per 100, • 5 less death per 100 need to be treated with new t/t • To have one less death, how many need to be treated? • What if Risk difference is 10%; 20%; 50% • NNT = 100/RD (%); in decimals 1/RD
A True Story • Husband and pregnant wife meet their doctor • Husband asks : When is the delivery expected doctor? • Doctor : What’s the LMP • Wife : 1st March 2009 • Doctor : EDD is 8th December 2009 • Husband : OK, I will be here on 7th Dec. 2009 • Doctor : Oh sorry, the delivery may be earlier or later than 7th Dec. • And so on
Degree of desired confidence level determines the width of the range (Interval)
Similarities b/w EDD range and C.I. • Both need data and calculation • Both capture the margin of error • Both indicate range of possibilities • Width of the range is directly related to the desired level of certainty • This is only one point of true or right value in both
Differences b/w EDD range & C.I. • EDD predicts about individual whereas C.I. about population • No definite formula for EDD but for every C.I. there is definite formula • Formula for C.I. differs depending on the type of data (no such for EDD) • Width of C.I. inversely related to sample size (? In EDD)
Newspaper headlines • Barack Obama’s popularity rating is 55% (error +/- 10%) • How to reduce the error? • Bigger the sample size, less the error; and narrower is the width of CI • How much width of CI is acceptable? • 45% (error +/- 10%) • 65% +/- 10%
Two more concepts • Width of CI at a level (say 95%) depends on the sample size • Bigger the sample size, narrower the CI • A good width of CI is the one which yields the same answer at both its ends (limits)
What is 95% confidence interval? • 95% confident that the true effect is within the range • A point in the centre is the finding from the study subjects • Lines on either side denote the margin of error (range of values consistent with the data)
Interventions Q vs Placebo Study D (N=4000) (-0.1% to - 2%) Interventions P vs Placebo Study Q (N=400) (-1% to - 19%) -50 -40 -30 -20 -10 0 10 20 30 40 50 Risk difference 95% C.I. For two studies with small (C) and Large (D) sample size. p values approx 0.03 for both studies
Interventions Y vs Placebo Study B (N=10,000) (-0.1% to + 0.1%) Study A (N=20) Interventions X vs Placebo (-48% to + 48%) -50 -40 -30 -20 -10 0 10 20 30 40 50 Risk difference 95% C.I. For two studies with small (A) and Large (B) sample size. p values 1.0 for both studies