Download
1 / 25
330 likes | 788 Vues
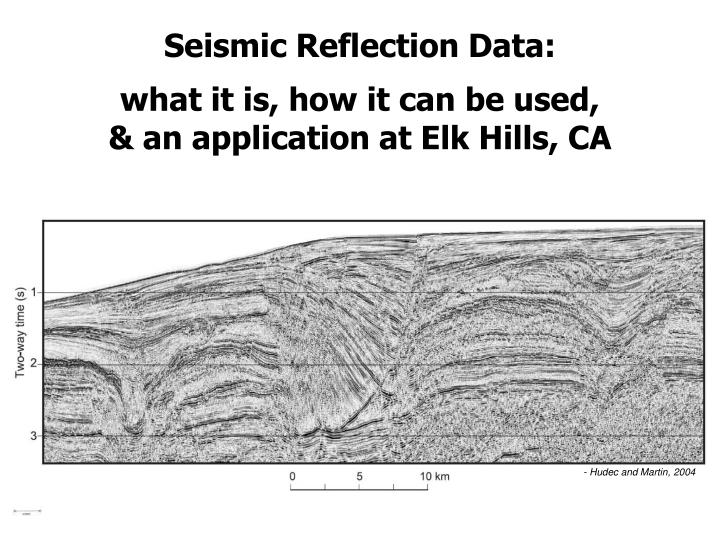
Seismic Reflection Data: what it is, how it can be used, & an application at Elk Hills, CA. - Hudec and Martin, 2004. Seismic Reflection Data: Definition. Seismic Reflection. return of a wave from a surface that it strikes into the medium through which it has traveled.

E N D
Seismic Reflection Data: what it is, how it can be used, & an application at Elk Hills, CA - Hudec and Martin, 2004
Seismic Reflection Data: Definition Seismic Reflection return of a wave from a surface that it strikes into the medium through which it has traveled subject to or caused by an earth vibration • Records seismic waves at the surface that are reflected off of subsurface stratigraphic interfaces - Clay, 1990 Images the subsurface using acoustic methods
Seismic Reflection Data:Acquisition • Source • Receivers reflection patterns are described by Snell's Law - Kansas Geological Survey grid of receivers for 3D survey: inlines Spacing 12.5 m for Wytch Farm Oil Field 16.7 m for Elk Hills Oil Field cross lines
Seismic Reflection Data:Processing Common Midpoint Method - http://walter.kessinger.com/work/seisx_processing.html
Seismic Reflection Data:Processing Seismic x-section two-way travel time (ms) - Kansas Geological Survey • interface reflects energy proportional • to impedance difference • impedance = velocity x porosity • subsurface geometries are reconstructed • stratigraphic sections show up layered
Seismic Reflection Data:Resolution Vertical Horizontal Minimum separation between two features such that we can tell that there are two features rather than only one
Seismic Reflection Data:Interpretation Time slice Cross -section
Seismic Reflection Data:Interpretation 2D image of normal faults from offshore Lebanon: http://www.mines.edu/academic/geology/faculty/btrudgil/research.html due to faulting Stratigraphic variations Faulting on the order of 30+ meters due to depositional changes
Structural Applications Individual layers and faults Various scales of interpretation (Scale for this x-section) Stratigraphic packages and fault zones - Kattenhorn and Pollard, 2001 - Fort et al., 2004
Seismic Reflection Data:Application Elk Hills Oil Field 20 miles east of the San Andreas Fault - http://rst.gsfc.nasa.gov
Elk Hills: Motivation Part 1 of 2 step project Ultimate goal: fracture (stress) prediction across a specified stratigraphic layer Elastic models forward model for slip-induced stress perturbations • fracture pattern today is a composite of • fracturing during each distinct slip event • slip-induced stresses vary as faults interact • evolutionary history important!
Elk Hills: Motivation Gain insight into fault geometry and timing at Elk Hills Industry: implications for hydrocarbon entrapment and charge General: implications for evolution of thrust systems
Elk Hills: Stratigraphy McDonald structure • Syn-depositional growth faulting: • Thinning onto highs • Thickening across faults • Use sedimentary features to constrain fault movements with time of deposition of specific layers A’ N NWS B’ 29R 31S A B 2 mi B’ West East A’ B A
Elk Hills: Stratigraphic Constraints • Stratigraphic Constraints on Fault Timing: • 2D analysis (cross sections) • 3D analysis (isochores) • Chronological fault evolution model
Calitroleum ms MYA4-A Wilhelm Calitroleum BRR Elk Hills: Stratigraphic Constraints Pseudowell analysis N A’ West Pseudowell thickness plots A 2 mi A A’ A A’ NE SW
Elk Hills: Stratigraphic Constraints Cross section analysis Fault Movement Indicators Example 1: Onlap Active faulting and uplift during deposition Syn-faulting strata
Elk Hills: Stratigraphic Constraints Cross section analysis Fault Movement Indicators Example 2: Offset beds of equal thickness Faulting post deposition Pre-faulting strata
Elk Hills: Stratigraphic Constraints Cross section analysis Fault Movement Indicators SW NE
0.5 mile Elk Hills: Stratigraphic Constraints Cross section analysis Fault Movement Indicators 100 ms Offset onlap: 1. 3R>1R 2. 3R>BRR
Elk Hills: Stratigraphic Constraints x1 x2 x3 x4 x5 MYA4-A Wilhelm Calitroleum 500 ms BRR McDonald 1 mile Isochore: line drawn through points of equal vertical (apparent) thickness of a unit
Elk Hills: Stratigraphic Constraints Two Signatures: 1. Close contours A A’ • fault cut • interval • at time • (syn tectonic) a) A’ A 2. Thin beds Structural high A A’ b) A’ b) fault below interval (syn tectonic) c) c) filled in paleo high (post tectonic) A
5R 1R 3R 2R ft 0 1 2 miles 0 2 6 km 4 Elk Hills: Stratigraphic Constraints 5R A A’ BRR 1R 2R McDonald 3R Isochore: McDonald to Base Reef Ridge N Structural high - active fault 2R 1R A’ 2R 3R Fault cut Structural high - active fault 3R 1R 7 7 5R 6R A 5R No expression - inactive fault 6R
B’ B 6R 7 east Elk Hills: Stratigraphic Constraints Conclusions from all stratigraphic analyses A A’ 5R 1R 2R 3R fault initiations bracketed between horizons: west Active faults 6R 2R, 3R, 1R, 5R 2R, 3R, 1R, 5R 2R, 3R, 1R 2R, 3R, 1R McDonald 7, 2R, 3R - Reid, 1990
Elk Hills: Stratigraphic Constraints N A’ B’ 29R Conclusions from all Analyses 31S A 2 mi B WEST A’ A 3R Stage 1 EAST B’ B pre-McDonald (mid Miocene) 7 Stage 1 A’ A 2R pre-McDonald (mid Miocene) 3R Stage 2 B’ B pre-McDonald (mid Miocene) 6R 7 Stage 2 A’ A 2R 1R Post MYA-4A (late Pliocene) Stage 3 3R pre-Base Reef Ridge (early Pliocene) 5R A A’ 2R 1R Stage 4 3R pre-Wilhlem (mid Pliocene)
Elk Hills: Stratigraphic Constraints • Fault Geometry & Timing • input for elastic models • determine faulting related • stress perturbations