Download
1 / 10
100 likes | 175 Vues
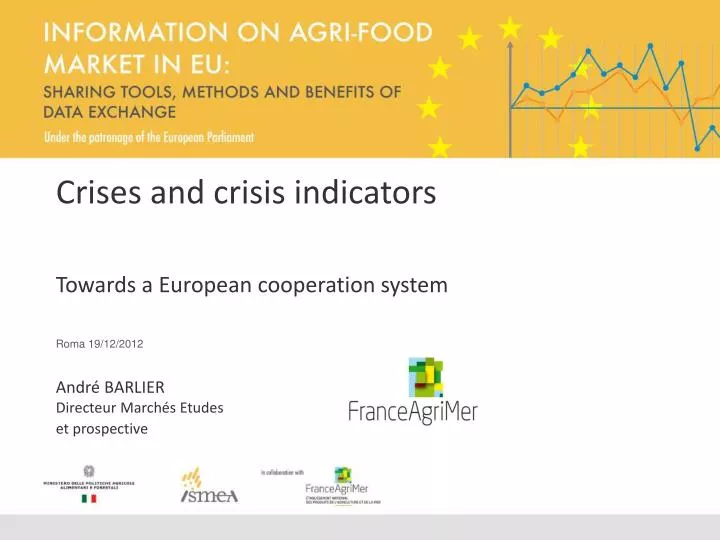
Crises and crisis indicators. Towards a European cooperation system Roma 19/12/2012. André BARLIER Directeur Marchés Etudes et prospective. « CAP 2013 » CONTEXT . EU financial perspectives for 2014-2020. Decision -making procedure. Other common policies. CAP.

E N D
Crises and crisis indicators • Towards a European cooperation system • Roma 19/12/2012 André BARLIER Directeur Marchés Etudes et prospective
« CAP 2013 » CONTEXT EU financial perspectives for 2014-2020 Decision -making procedure Other common policies CAP 1st pillar EAGF Single CMO Milk package tool kit 2nd pillar EAFRD 1st pillar EAGF Direct payments Green paper on promotion Agr GL quality package
The question of managing risks and crises in the agricultural sector in « CAP 2013 » debates EU financial perspectives for 2014-2020 Decision- making procedure ResearchBudget CAP Budget 1st pillar EAGF Single CMO Milk Package Crisis Fund PEAD tool kit Council + Parliament Delegated acts implementing acts ESF ERDF, EFFMA Coherence funds 2nd pillar EAFRD Common Strategic Framework 1st pillar EAGF DPU=>DPB Globalisation adjustment fund Green paper on promotion Agr GL Quality package
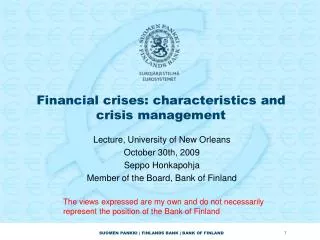
How to define a crisis variability range Simplified mapping Epiphenomenon Crisis Tolerable limit of the variability Trend Background Time Time limit beyond which variability range results in economic hardship for a significant proportion of players
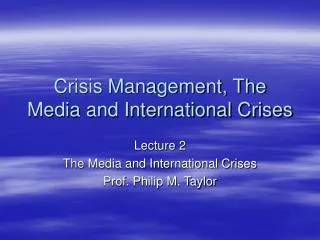
Diagram of a crisis situation in the agricultural sector Epiphenomenon crisis period Tolerable variability about "normal" The definition of the crisis has to be set by product, particularly in:tolerable variability in terms of prices around a situation considered "normal"and minimum periods below (or above) this tolerable variability from which one enters into crisis and out of crisis in the sector (1) One example in FR for the moderation margin agreement in the F& V sector Crisis entry time Crisis exit time
Proposed typology of crisis The goal is to help public judgment and decision on the nature of crises and possibly help in the choice of tools for prevention and management best suited to the characteristics of events. This proposed typology is based on the combination of three features often used as predictors of crises in agriculture : Their "nature“. There are classically cyclical crises, structural crises ... (questionable in theory)Their factors or attachment point . The terms refers here to a combination of economic variable (offer or demand) whose variation has generated the crisis, and the “product scope " (territorial level and qualitative segments) on which this crisis is observed. We are looking here at the relationship between price and ratio "Availability / Uses" Their "cause or origin" health crisis, climate ... Identifying the type of crisis requires having an information system tailored to the scope of the monitored market (supply, demand, price)
Consequences for the information systems on markets To develop specific crisis indicators a tailored information system should be defined through : - A structural analysis to determine, sector by sector, the scope of the markets in which there is a challenge to manage crises (to review every 5 years ?) - A conjuncturalmonitoring with usual variables : geographical scale, time scale, marketing stage, type of information at each stage, relevant unit.
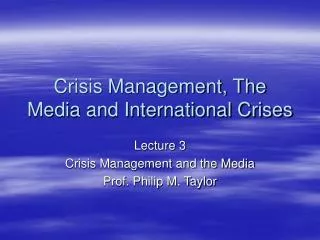
Content of an information system on the markets, suitable for tracking crises (1) 1:Minimal geographic scale NUTS2 region : Dairy or Wine basin 2: Time scale • Observation frequency • Entry & exit limits • Inertia • Seasonal adjustment • Discontinuous calendar Campaign The method used for F&V is not suitable for wheatfor example
representative Prices • Availability (for supply) • Volumes of transactions (for demand) Forecasting balance Content of an information system on the markets, suitable for tracking crises (2) 3 : Marketing stage Preferably at production stage (depending CAP) 4 : Kind of information 5 : Suitable units Size, choice, consistency To state that a market is in crisis should be defined before the tolerable variability for example a % of price change around the trend. Everyone unterstands that this topic is partly economic partly political.
.........Temporay conclusion • The goal is not to challenge the existing market observation systems but to work for more coherence and homogenisation. • In this perspective, it will be useful to be able to mobilise a network of experts to add qualitative, particularly in determining the attachment points of crises during the campaign, or to identify at the earliest the potential structural nature of a crisis • Ultimately this can help to propose harmonisation and adaptation of various parameters of the system to different sectoral market realities at the EU level Grazie per la vostra attenzione Merci de votre attention