Download
1 / 70
700 likes | 800 Vues
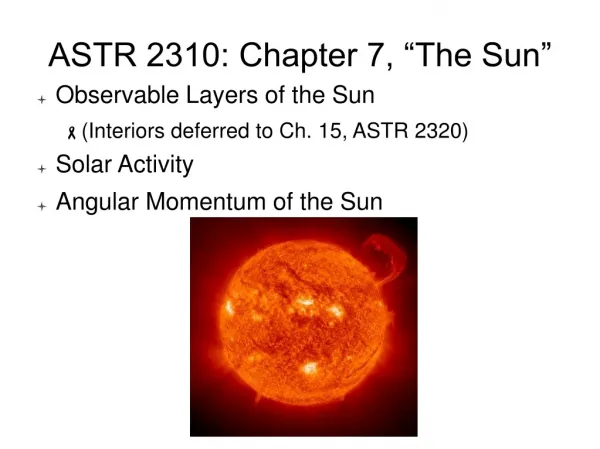
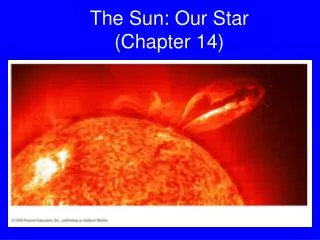
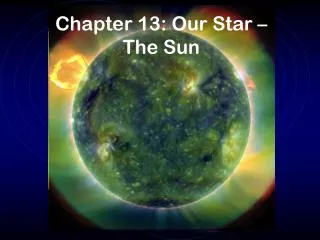
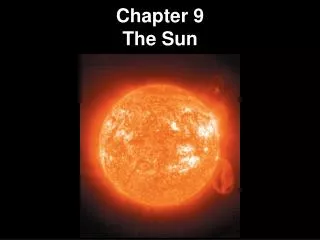
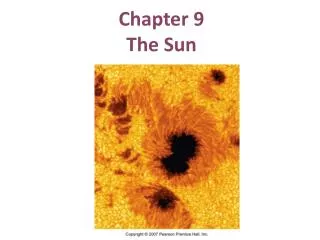
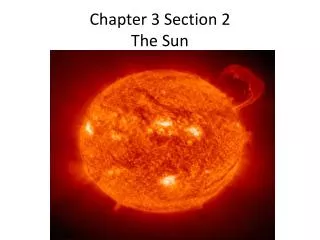
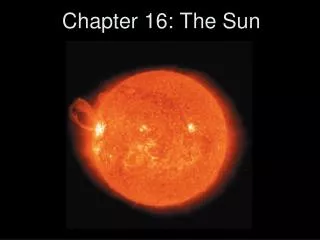
Chapter 9 The Sun. Sunspots. Our Sun. Is the nearest star 8 light minutes away Next nearest star is 4.3 light-years away (300,000X further than sun). Figure 9.1 The Sun. Table 9.1 Some Solar Properties. Solar Rotation. Differential rotation Measure by timing sunspots Faster at equator

E N D
Our Sun • Is the nearest star • 8 light minutes away • Next nearest star is 4.3 light-years away (300,000X further than sun)
Solar Rotation • Differential rotation • Measure by timing sunspots • Faster at equator • Slower at poles • X-ray and visible light movie of sun
Solar Structure • Core • Radiation zone • Convection zone • Photosphere (“surface” we see) • Chromosphere • Transition zone • Corona • Solar wind
Solar Luminosity • Solar constant 1400 W/m2 above earth’s atmosphere • 1000 W/m2 at earth’s surface • Solar constant and distance to sun gives luminosity of about 4 X 1026 W
Stellar balance • Outward pressure of hot gas • Inward pull of gravity • Balanced at every point in a star
Standard solar model • Mathematical and physical model of sun • Based on observations and physical laws • Predicts density and temperature • Helioseismology allows knowledge of interior structure
Sun’s temperature and density • Core density 150,000 kg/m3 (20X iron) • Core temperature 15 million K • Core is a gas (plasma) • Photosphere is 0.0001X density of earth’s atmosphere • Photosphere temperature 5780 K
SOHO • Solar and Heliospheric Observatory • European Space Agency
Solar energy transport • Near core - very hot • Gas is completely ionized (plasma) • No photons captured - transparent to radiation • Outer edge of radiation zone cool enough for electrons to re-combine with nuclei • Photons all absorbed
Convection Zone • Energy transported by rising hot gases • Cooler gas sinks • Convection cells vary in size with depth in convection zone • Tens of thousands of km to a thousand km convection cells • Photons from photosphere escape into space
Evidence for convection • Solar granulation of photosphere • Granules size of a large US state • Last 5 to 10 minutes • Bright regions - hot gas rising • Dark regions - cool gas sinking • 500 K difference between hot and cool
Solar Granulation movie • Near infrared • 60 minute sequence sped up • At http://www.bbso.njit.edu or click here
Doppler shift • Bright granules move up at about 1 km/s • Dark granules move down at about 1 km/s
Supergranulation • Larger scale flow beneath solar surface • 30,000 km across
Composition of solar atmosphere • Primarily H and He • Also O, C, N, Si, Mg, Ne, Fe, S • Similar to Jovian planets and rest of universe
Solar chromosphere • Above photosphere and less dense • Pinkish hue from H emission • Expelling jets of hot matter - spicules • Last minutes • 100 km/s
Corona • Corona visible during total solar eclipse • Emission spectrum visible against blackness of space • Ionized atoms - high coronal temperatures
Transition Zone • Minimum temperature of 4500 K in chromosphere • Temperature climbs through transition zone • Reaches several million K in corona
Solar wind • Starts 10 million km above photosphere • Hot coronal gas escapes sun’s gravity • Millions of tons of sun ejected each second • Only lost 0.1% of mass in 4.6 billion years
X-rays in corona • Photosphere emits primarily visible light • Hotter corona emits primarily X-rays • Coronal holes - visible in X-rays • Solar wind escapes in coronal holes • Related to magnetic fields
Sunspots • In photosphere • Cooler (darker) than surrounding material • Dark umbra (4500 K) • Grayish penumbra (5500 K) • Typically 10,000 km across (size of earth)
Sunspot magnetism • Magnetic field of photosphere stronger than earth’s • Magnetic field in sunspots is 1000X greater than surrounding photosphere • Field lines perpendicular to surface • Strong fields interfere with convective flow • Causes sunspots to be cooler
Sunspot magnetic polarity • Sunspots in pairs at same latitude • Pair members have opposite polarity N&S • Leading spot in a hemisphere always has same polarity • Leading spot in other hemisphere has opposite polarity
Magnetic field wrapping • Differential rotation “wraps” magnetic field • North-south re-oriented to east-west • Convection lifts field to surface • Twisting and tangling results • Some kinks rise out of photosphere • Forms sunspot pair
Maunder minimum • Cycle varies from 7 to 15 years • Overall activity varies • Solar inactivity from 1645-1715 • Maunder minimum caused “Little Ice Age”