Download
1 / 7
70 likes | 72 Vues
Calculate probabilities and analyze categorical data using bar graphs, marginal and conditional distributions, and identify deceptive graphs.

E N D
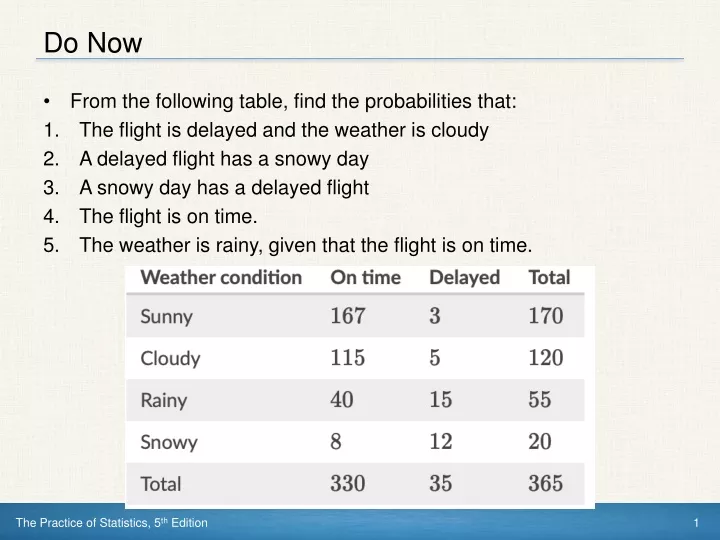
Do Now • From the following table, find the probabilities that: • The flight is delayed and the weather is cloudy • A delayed flight has a snowy day • A snowy day has a delayed flight • The flight is on time. • The weather is rainy, given that the flight is on time.
Analyzing Categorical Data • DISPLAY categorical data with a bar graph • IDENTIFY what makes some graphs of categorical data deceptive • CALCULATE and DISPLAY the marginal distribution of a categorical variable from a two-way table • CALCULATE and DISPLAY the conditional distribution of a categorical variable for a particular value of the other categorical variable in a two-way table • DESCRIBE the association between two categorical variables
Omissions Types of Qualitative Variables • Discrete variable – ONLY measured in whole numbers • Continuous variable – CAN BE measured in decimals • Examples: • Shoe Size • Height • Number of classes you take in a semester • Number of burgers cooked per day at Burger King • GPA • SSN
FRAPPY – Free Response AP Problem Yay! • Some Fridays during the school year, we will do what’s called a FRAPPY (Free Response AP Problem Yay!). It will serve as a “check for progress” for roughly a week’s worth of material. • Section I of AP Stats Exam: 40 MCQ in 90 minutes. • Section II of AP Stats Exam: 6 FRQ in 90 minutes • There are 5 normal FRQs on the AP Exam (65 minutes – 13 minutes each) • There is 1 Investigative Task FRQ on the AP Exam (25 minutes; pulls together multiple standards)
FRAPPY – Race and the Death Penalty Expectations: • 13 minutes (just like real exam!) • Silent • Independent • No notes • Work the best you can • Read the problem TWICE before beginning work • We will self-grade using the actual scoring rubric
Classwork • Pg. 22: 20-22; pg. 23: #27-29
Homework • Study for quiz 1.1 tomorrow (look over Wednesday’s PowerPoint OR read pages 7-19 in book; look over notes and practice problems) • Suggested practice problems: • Pg. 22: 20-22; pg. 23: #27-29