Download
1 / 25
260 likes | 456 Vues
Microbursts. Microbursts. Discovery Climatology Forcing Mechanisms Conceptual Models Forecasting. Discovery. The Super Outbreak: Occurred on 3 April 1974 Aerial damage surveys by Fujita revealed distinct “starburst” pattern in the surface damage 15% of damage was

E N D
Microbursts M. D. Eastin
Microbursts Discovery Climatology Forcing Mechanisms Conceptual Models Forecasting M. D. Eastin
Discovery • The Super Outbreak: • Occurred on 3 April 1974 • Aerial damage surveys by • Fujita revealed distinct • “starburst” pattern in the • surface damage • 15% of damage was • associated with • similar patterns • Very different than • the swirling damage • pattern left by a • tornado • Idea of a ”microburst” • was conceived “Starburst” wind damage pattern in a forest From Fujita (1985) M. D. Eastin
Eastern Airlines Flight 66: • Occurred on 24 June 1975 • Boeing 727 crashed while • landing and at JFK airport • 112 deaths, 12 injuries • Cause of crash unknown but • thunderstorms were in the area • The NTSB asked Fujita to • investigate the cause • After analyzing only flight data • recorders, pilot reports, and an • airport anemometer, Fujita • hypothesized that Flight 66 flew • through a low-level diverging • wind field – a microburst From Fujita (1985) M. D. Eastin
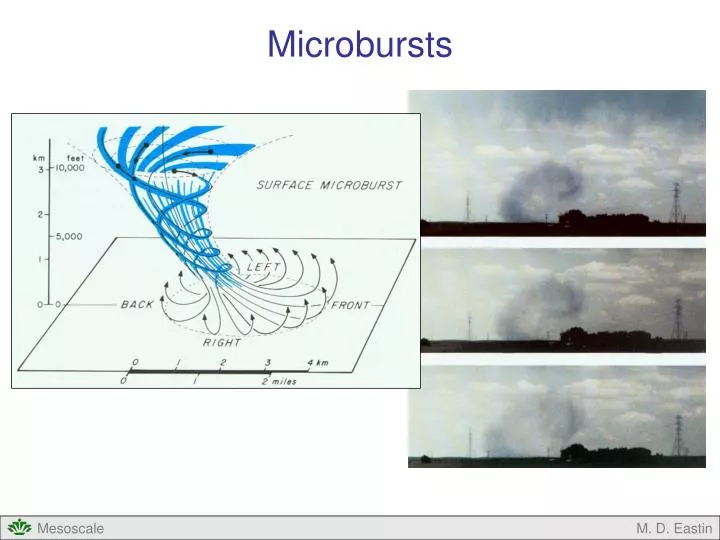
Discovery • Definition and Direct Observations: • Microburst: A strong downdraft that • induces an outburst of • damaging, divergent winds • as high as 75 m/s on or • near the ground over an • area of 1-4 km • Northern Illinois Meteorological Research of Downbursts (NIMROD) • First field program dedicated • to microburst detection • Summer 1978 • Multiple research Doppler radars • Provided the first evidence of • of a microburst Radial velocities from the first detected microburst From Wilson and Wakimoto (2001) M. D. Eastin
Climatology • Severe Wind Events: • No comprehensive climatology • of microbursts exists • Kelly et al. (1985) compiled • over 75,000 severe wind • reports from 1955-1983 • Attempted to remove reports • from tropical cyclones or those • not associated with deep • convection (downslope winds) • Does NOT distinguish damage • created from different convective • mean (gust fronts, microbursts, • derechos) From Kelly et al. (1985) M. D. Eastin
Climatology • Severe Wind Events: • Occur year-round • at all times during • the day and night • Most often occur in • the late afternoon • and evening during • the summer months From Kelly et al. (1985) M. D. Eastin
Climatology • Limited Microburst Data from Field Programs: • Northern Illinois Meteorological • Research on Downbursts • (NIMROD) – Summer 1978 • Joint Airport Weather Studies • (JAWS) – Summer 1982 • FAA / Lincoln Lab Operational • Weather Studies (FLOWS) – • Summers of 1985 and 1986 • Microbursts and Severe • Thunderstorm (MIST) • project – Summer 1986 From Wilson and Wakimoto (2001) M. D. Eastin
Climatology • Limited Microburst Data from Field Programs: • A total of 168 microbursts occurred during JAWS • over the 86 day field program • Diurnal variability similar to Kelly et al. (1985) results • Over 80% were “dry” microbursts associated with little • or no precipitation at the surface (more on this later) From Wakimoto (1985) M. D. Eastin
Climatology • Limited Microburst Data from Field Programs: • A total of 62 microbursts occurred during MIST • over the 61 day field program • Diurnal variability similar to Kelly et al. (1985) results From Atkins and Wakimoto (1991) M. D. Eastin
Forcing Mechanisms • Vertical Momentum Equation: • Recall the vertical momentum equation for the mesoscale: • A B C D • Term A: Vertical gradient of perturbation pressure • Tends to be negligible in low shear environment • Can intensify downdrafts in very strong shear environments • Term B: Thermal Buoyancy (e.g., CAPE or DCAPE) • The most important forcing for most convective downdrafts • Negative buoyancy (locally cold air) will induce a downward acceleration • Results from the entrainment of sub-saturated air into a parcel and then • cooling from evaporation and/or melting or cloud and precipitation particles M. D. Eastin
Forcing Mechanisms • Vertical Momentum Equation: • Recall the vertical momentum equation for the mesoscale: • A B C D • Term C: Water-Loading • Tends to be smaller than thermal buoyancy • Plays a primary role in downdraft initiation • Plays less of a role in downdraft maintenance or intensification • Term D: Entrainment Mixing • Plays a significant role in modulating the downdraft intensity • Entrainment often introduces warm dry air into the parcel, which leads to: • → Evaporation and the generation of negative thermal buoyancy • → Reduction of negative thermal buoyancy M. D. Eastin
Forcing Mechanisms • The “Catch-22” regarding Entrainment: • Numerous numerical simulations have revealed that entrainment can be detrimental to • (or weaken) downdraft intensity • Srivastiva (1985) • One-dimensional downdraft model • Specify: Environmental P, T, RH • Drop size distribution • Initial downdraft velocity • Recall: When air descends it warms • adiabatically and becomes • sub-saturated → entrainment • is notneeded in order for • evaporational cooling to occur • In most cases (realistic lapse rates) some entrainment will intensify the downdraft, but too much entrainment will weaken the downdraft Parcel Temperature Excess Parcel Relative Humidity Vertical Motion Numbers on each line are entrainment rates: 0 → no entrainment 10 → lots of entrainment M. D. Eastin
Conceptual Models • 2-D Model: • Developed by Fujita (1985) • At touchdown, the microburst is characterized by a strong central shaft of descent with • strong divergence on either flank • Soon after, an outburst of strong winds with a “rotor” circulation spreads outward • The strongest winds are often found near the base of the rotors • The rotors result from: Baroclinic generation on the cold downdraft flanks • Tilting of vertical vorticity into the horizontal Rotor Circulations M. D. Eastin
Conceptual Models 2-D Microburst Example: Andrews Air Force Base – 1 August 1983 M. D. Eastin
Conceptual Models • 3-D Model: • Also developed by Fujita (1985) • Notice the small intense • rotation associated with • the downdraft • Most microbursts exhibit • some rotation • Rotation is believed to • enhance microburst strength • by limiting entrainment • (recall the same effect of • rotation for supercells • and tornadoes) M. D. Eastin
Conceptual Models • Types of Microbursts: • A large number of studies have indicated that microbursts are associated • with a continuum of rain rates, ranging from very heavy precipitation to • virga shafts (with no precipitation at the surface) • There is no correlation between rain rate and microburst intensity • Dry Microbursts: • A microburst associated with < 0.25 mm of rainfall or a radar echo < 35 dBZ • Wet Microbursts: • A microburst associated with > 0.25 mm of rainfall or a radar echo > 35 dBZ M. D. Eastin
Conceptual Models • Dry Microbursts: • Photograph and near-surfacedual-Doppler • radar observations of a dry microburst Photo by B. Waranauska M. D. Eastin
Conceptual Models • Dry Microbursts: • Environment: • High cloud bases (~600-500 mb) • Deep, dry-adiabatic, well-mixed • boundary layer • Dry sub-cloud layer • Moist mid-levels • Common in western U.S. • Physical Processes: • Largely driven by negative thermal • buoyancy generated by evaporation • of precipitation • Cooling is partially offset by adiabatic • warming, but it can not be completely • overcome • Parcel accelerates to the ground • Produces very strong downdrafts at • the surface Gray area DCAPE M. D. Eastin
Conceptual Models • Dry Microbursts: • The temperature structure of the • sub-cloud layer is important • A not well-mixed boundary layer with • a lapse rates less than dry-adiabatic • could prevent a downdraft from • reaching the surface • At first, negative thermal buoyancy is • generated by evaporation and only • partially offset by adiabatic warming • Parcel begins to accelerate downward • Then, due to lapse rate changes, the • parcel could become warmer than • the environmental air and stops • accelerating downward • No microburst M. D. Eastin
Conceptual Models • Wet Microbursts: • Photograph anddual-Doppler observations of near- • surface horizontal winds and radar reflectivity for • a wet microburst M. D. Eastin
Conceptual Models • Wet Microbursts: • Environment: • Low cloud bases (~150mb above surface) • A more stable sub-cloud lapse rate • Moist low levels • Dry mid-levels • Common in eastern U.S. • Physical Processes: • Largely driven by both water loading and • negative thermal buoyancy generated • by evaporational cooling • Often produces very strong downdrafts at • the surface when precipitation is heavy M. D. Eastin
Forecasting • Dry Microbursts: • Weak vertical wind shear (< 20 knots over 0-6 km AGL) • Moderate CAPE (~500-1000 J/kg; enough to generate single-cell deep convection) • Minimal capping inversion (CIN ~0 J/kg) • Deep and dry sub-cloud layer with a dry-adiabatic lapse rate to mid-levels (~500 mb) • Moist mid-troposphere (in order to support the deep convection) • Large DCAPE (>800 J/kg) for a 750mb parcel • Wet Microbursts: • Weak vertical wind shear (< 20 knots over 0-6 km AGL) • Moderate CAPE (~500-1000 J/kg; enough to generate single-cell deep convection) • Weak capping inversion (CIN ~25-50 J/kg) → helps increase the DCAPE • Shallow and moist sub-cloud layer with a dry-adiabatic lapse rate • Dry mid-troposphere • Large DCAPE (>800 J/kg) for a 750mb parcel M. D. Eastin
Microbursts • Summary: • Discovery • Definition • Direct Observations • Climatology • Frequency • Annual Cycle • Field Programs • Forcing Mechanisms • Conceptual Models • Two-Dimensional • Three-Dimensional • Wet vs. Dry Microbursts (environment and physical processes) • Forecasting • Wet Microbursts • Dry Microbursts M. D. Eastin
References Atkins, N.T., and R.M. Wakimoto, 1991: Wet microburst activity over the Southeastern United States: Implications for forecasting. Wea. Forecasting, 6, 470-482. Fujita, T. T., 1985: The downburst-microburst and macroburst. Satellite and Mesometeorology Research Project (SMRP) Research Paper 210, Dept. of Geophysical Sciences, Univ. of Chicago, (NTIS PB-148880) Feb. 1985. Fujita, T.T., 1985: The downburst. SMRP Res. Paper No. 210, NITIS PB 85-148880. 122 pp. Kelly, D.L., J.T. Schaefer and C.A. Doswell III (1985): Climatology of nontornadic severe thunderstorm events in the United States. Mon. Wea. Rev., 113, 1997-2014. McCarthy, J., J. W. Wilson, and T. T. Fujita, 1982: The Joint Airport Weather Studies Project. Bull. Amer. Meteor. Soc., 63, 15-22. Srivastava, R. C., 1985: A simple model of evaporatively driven downdraft: Application in microburst downdraft. J. Atmos. Sci., 42, 1004–1023. Srivastiva, R. C., 1987: A model of intense downdrafts driven by the melting and evaporation of precipitation. J. Atmos. Sci., 44, 1752–1773. Wakimoto, R.M., 1985: Forecasting microburst activity over the High Plains. Mon. Wea. Rev., 113, 1131-1143. Wilson, J.W. and R.M. Wakimoto, 2001: The discovery of the downburst: T.T. Fujita’s contribution. Bull. Amer. Meteor. Soc., 82, 49-62. M. D. Eastin