Download
1 / 1
10 likes | 148 Vues
Fig 2. Principal Component Analysis PCA using the NIPALS algorithm (left). Fold changes in representative defense related candidate genes identified in microarray results for 1 d.p.i. Fig 1. Flow sheet for complete experimental work.

E N D
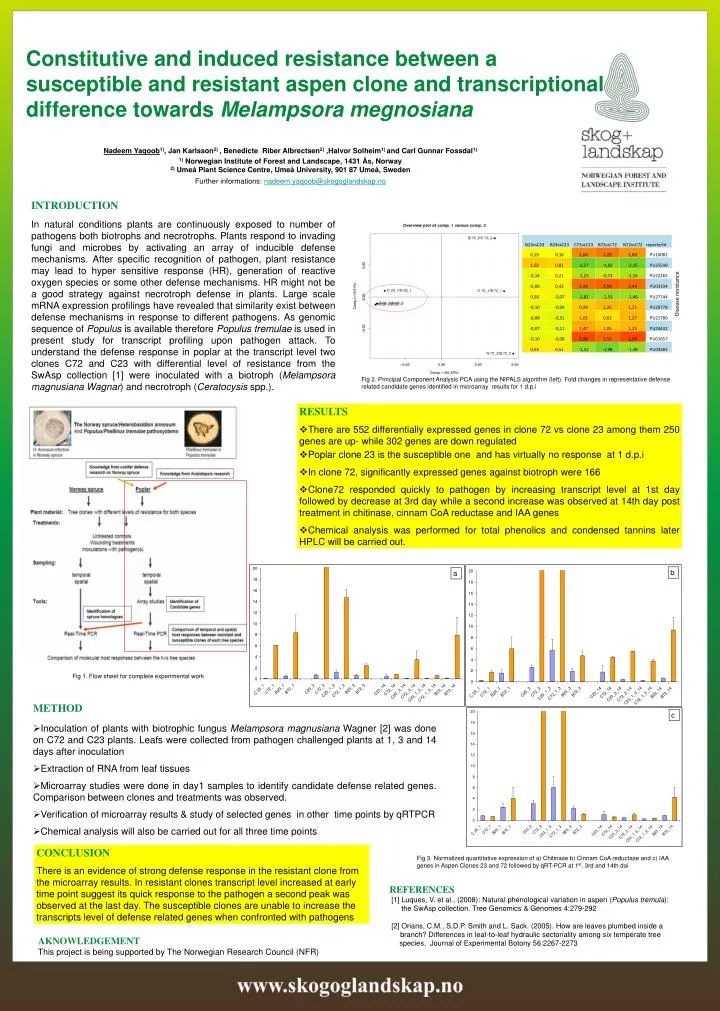
Fig 2. Principal Component Analysis PCA using the NIPALS algorithm (left). Fold changes in representative defense related candidate genes identified in microarray results for 1 d.p.i Fig 1. Flow sheet for complete experimental work Constitutive and induced resistance between a susceptible and resistant aspen clone and transcriptional difference towards Melampsora megnosiana Nadeem Yaqoob1), Jan Karlsson2) , Benedicte Riber Albrectsen2) ,Halvor Solheim1) and Carl Gunnar Fossdal1) 1) Norwegian Institute of Forest and Landscape, 1431 Ås, Norway 2) Umeå Plant Science Centre, Umeå University, 901 87 Umeå, Sweden Further informations: nadeem.yaqoob@skogoglandskap.no INTRODUCTION In natural conditions plants are continuously exposed to number of pathogens both biotrophs and necrotrophs. Plants respond to invading fungi and microbes by activating an array of inducible defense mechanisms. After specific recognition of pathogen, plant resistance may lead to hyper sensitive response (HR), generation of reactive oxygen species or some other defense mechanisms. HR might not be a good strategy against necrotroph defense in plants. Large scale mRNA expression profilings have revealed that similarity exist between defense mechanisms in response to different pathogens. As genomic sequence of Populus is available therefore Populus tremulae is used in present study for transcript profiling upon pathogen attack. To understand the defense response in poplar at the transcript level two clones C72 and C23 with differential level of resistance from the SwAsp collection [1] were inoculated with a biotroph (Melampsora magnusiana Wagnar) and necrotroph (Ceratocysis spp.). • RESULTS • There are 552 differentially expressed genes in clone 72 vs clone 23 among them 250 genes are up- while 302 genes are down regulated • Poplar clone 23 is the susceptible one and has virtually no response at 1 d.p.i • In clone 72, significantly expressed genes against biotroph were 166 • Clone72 responded quickly to pathogen by increasing transcript level at 1st day followed by decrease at 3rd day while a second increase was observed at 14th day post treatment in chitinase, cinnam CoA reductase and IAA genes • Chemical analysis was performed for total phenolics and condensed tannins later HPLC will be carried out. b a • METHOD • Inoculation of plants with biotrophic fungus Melampsora magnusiana Wagner [2] was done on C72 and C23 plants. Leafs were collected from pathogen challenged plants at 1, 3 and 14 days after inoculation • Extraction of RNA from leaf tissues • Microarray studies were done in day1 samples to identify candidate defense related genes. Comparison between clones and treatments was observed. • Verification of microarray results & study of selected genes in other time points by qRTPCR • Chemical analysis will also be carried out for all three time points c CONCLUSION There is an evidence of strong defense response in the resistant clone from the microarray results. In resistant clones transcript level increased at early time point suggest its quick response to the pathogen a second peak was observed at the last day. The susceptible clones are unable to increase the transcripts level of defense related genes when confronted with pathogens Fig 3. Normalized quantitative expression of a) Chitinase b) Cinnam CoA reductase and c) IAA genes in Aspen Clones 23 and 72 followed by qRT-PCR at 1st, 3rd and 14th dai REFERENCES [1] Luques, V. et al., (2008): Natural phenological variation in aspen (Populustremula): the SwAsp collection. Tree Genomics & Genomes 4:279-292 [2] Orians, C.M., S.D.P. Smith and L. Sack. (2005). How are leaves plumbed inside a branch? Differences in leaf-to-leaf hydraulic sectoriality among six temperate tree species. Journal of Experimental Botony 56:2267-2273 AKNOWLEDGEMENT This project is being supported by The Norwegian Research Council (NFR)


