Download
1 / 74
740 likes | 863 Vues
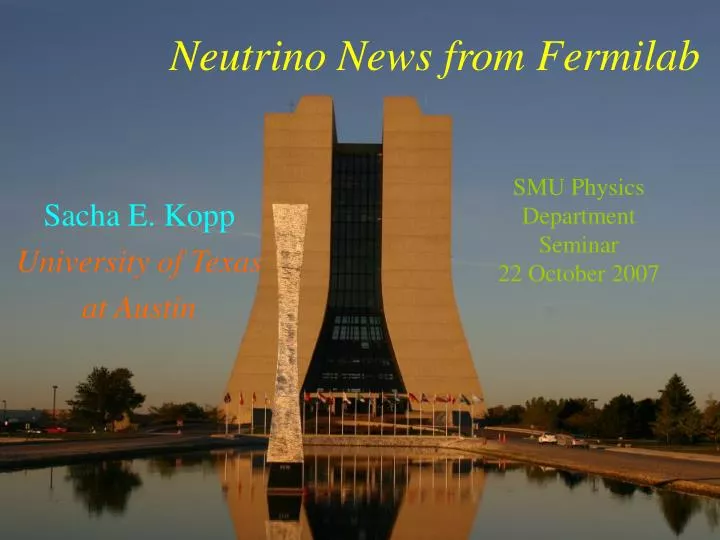
Neutrino News from Fermilab. Neutrino Flavor Oscillations at the Fermilab Main Injector. SMU Physics Department Seminar 22 October 2007. Sacha E. Kopp University of Texas at Austin. Quantum Mechanics and Double Slit Experiments. Particles exhibit wave interference

E N D
Neutrino News from Fermilab Neutrino Flavor Oscillations at the Fermilab Main Injector SMU Physics Department Seminar 22 October 2007 Sacha E. Kopp University of Texas at Austin
Quantum Mechanics andDouble Slit Experiments • Particles exhibit wave interference • Indeterminacy (pattern lost if measure which slit) • One particle vs ensemble • Interpretation: probability waves e- ? ? A Tonomura et al., Am. J. of Phys.57 117-120 (1989)
What We Observe “at the Screen”: Lepton Number • Why must the muon decay weakly? • Long lifetime result of heavy W • Lifetime t~2ms m- e-ne nm • More favorable decay m- e-g • Electromagnetic interaction • Should have lifetime ~10-18 sec • Observed rate < 1.2 10-11 of all m decays (M.L. Brooks et al, Phys. Rev. Lett. 83, 1521 (1999) Lm +1 0 0 +1 Le 0 +1 -1 0 Lepton Number! Lm +1 0 0 Le 0 +1 0
n’s Have Lepton Number • Nuclear b decay has e, reactors produce ne • Reines & Cowen exp’t to observe free ne ne + p e+ + n Reines & Cowan, Science 124, 103 (1956), Phys. Rev. 113, 273 (1959) • Contrast to “failed” experiment by R. Davis ne + 37Cl e- + 37Ar R. Davis, Phys. Rev. 97, 766 (1955) NOT OBSERVED
n’s Have Lepton Number (cont’d) Saw lots of… • In 1957, Brookhaven AGS and CERN PS first accelerators intense enough to make n beam p + Be p+ + X, p+m+n • 1962: Lederman, Steinberger, Schwartz propose experiment to see nm+ Nm- + X (Phys.Rev.Lett. 9, 36 (1962)) n nm+ Nm- + X Saw none of… n ne+ Ne- + X
Weak Interactions Conserve Lepton Number • Many exp’t confirmations of Lepton number conservation (m, t decays, etc) • Neutrino interactions conserve lepton number too. • But what happens to the neutrino in between creation/annihilation, while in flight? Lepton # Conserved m+ Lepton # Conserved p+ nm m- nm p+ m+ nm ? nm + N m- + X
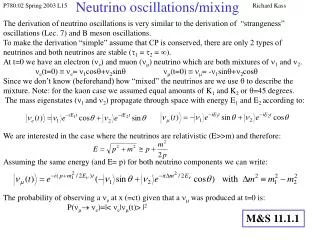
NB: sin2(x) because now talking about fraction of beam that disappears! • Suppose at t=0 have a state |y(0)= |nm. Later…? Probability{nmne}(t) sin2[Dm2t/4p] To see the effect, must haveEn/L~Dm2 Neutrino Double Slit Experiment • We create and observe |nm & |ne via weak interaction • But suppose n’s have mass 0. Can label them by |n1 -- the heavier mass state with m = m1. |n2 -- the lighter mass state with m = m2. • We do not know in which mass state the neutrino propagates (it’s an unknown ‘slit’) – must assume both interference! n1 nm nmor ne? n2 sin2[1.27Dm2L/En]
A Mixture of n States • How can a quantum state produced at t=t1 appear as a different quantum state at t=t2? • Mass eigenstates need not coincide with weak eigenstates (two indep. bases) |ne = cosq|n1 + sinq|n2 |nm = - sinq|n1 + cosq|n2 nm n2 q ne q n1 • Reminiscent of crossed polarizers.
n1 ne nm nm n2 n3 nt Neutrinos have 3 slits • The nt discovered 3 lepton flavors must exist (K. Kodama et al., Phys. Lett.B504218 (2001)] • Measurements of Z0 boson resonance only 2.9830.009 lepton flavors participate in weak interaction [S. Eidelman et al., Phys. Lett.B592, 1 (2004) ] • With 3 n families we expect • 3 mixing probabilities between flavor i j • 2 distinct mass splittings
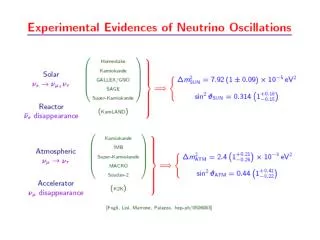
CHOOZ 90%C.L. sinq13<0.22 @ Dm2=210-3eV2 Phys.Lett.B466,415 (1999) Is this non-zero??? Large enough to measure CP in nmne sinqsolar <0.62 (Smirnov, hep/0309299) Super-K 90%C.L. sinq23>0.58 @ Dm2=210-3eV2 (hep-ex/0404034) Is the mixing angle truly maximal??? n Mixing Orthodoxy • If you believe in flavor mixing, there must be a 33 unitary transformation to mass states: sij sinqij cij cosqij • In the quarks, mixing matrix has phase d0 responsible for CP. But hopefully this picture is wrong or incomplete! (Peggy Lee: “Is that all there is?”)
Two Detector n Experiments FNAL CCFR experiment, 1982-83 CERN CHARM/CDHS experiments, 1982-83 • Near detector predicts n energy spectrum and rate at far detector (asssuming an absence of oscillations) • Greatly reduces systematic uncertainties due to calculating beam flux.
magnitude of suppresion fromsin2(2q) Dm2=0.005eV2 location of dip from Dm2 Interpretation of Oscillation Results E0 /5 E0 /32nd max E0 1st max • Oscillations into unknown flavor causes dip in obvserved spectrum. Oscillation Probability Neutrino Energy
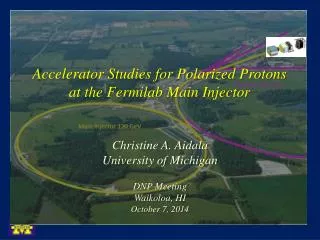
735 km Det. 2 Det. 1 Long Baseline n Oscillation Exp’s • Reproduce atmospheric n effect using accelerator beam • L ~ 100’s kilometers to match oscillation frequency Near Detector: 980 tons Far Detector: 5400 tons MINOS (Fermilab to Minnesota) L = 735 km 2005 K2K (KEK to SuperK) L = 250 km Concluded CNGS (Cern to Gran Sasso, Italy) L = 750 km tested 2006, run 2008
The Challenge of Long Baselines… LSND Nomad/ Chorus MINOS goal this analysis K2K MiniBooNE 2 n flavors Discovery of NC’s S. Kopp, “Accelerator Neutrino Beams,” Physics Reports 439, 101 (2007), arXiv:hep-ex/0609129
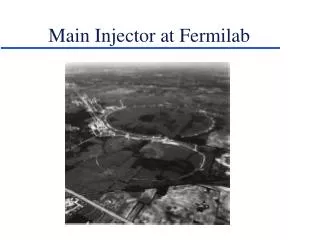
The NuMI Beam Main Injector Accelerator Plan View Extraction magnets Target Hall Access Tunnel Evacuated Decay Volume n beam Hadron Absorber target Near Detector Hall focusing horns Muon Alcoves Elevation View Surface Building Ground Level Surface Building Hadron Absorber Service Shaft Target Hall Evacuated Decay Volume n beam V118 Bend Carrier Tunnel Near Detector Hall V108 Bend Muon Alcoves
Neutrinos at the Main Injector Batch 2 Batch 3 ½ Batch (empty) • MI ramp time ~1.5sec • MI is fed 1.56ms batches from 8 GeV Booster • Simultaneous acceleration & dual extraction of protons for • Production of p (Tevatron collider) • Production of neutrinos (NuMI) • NuMI designed for • 8.67 ms single turn extraction • 41013ppp @ 120 GeV • Antiproton Production: • Requires bunch rotation (Dt~1.5nsec) • Merges two Booster batches into one batch (“slip-stacking”) Main Injector Batch 4 Batch 1 ½ Batch (empty) Batch 5 Batch 6 Pbar Target NuMI
Bend out of MI Lambertsons NuMI Proton Beam Line Final bend to Soudan
Target Hall Target Hall after Contractor completion Decay pipe Target/baffle Module installed Target Hall shielding installation
Focusing Horns Main horn field between conductors figure A. Marchionni, J. Hylen Horn 2 suspended from shielding module being lowered into shielding pit Hall probe moving along horn axis
MINOS Far Detector magnetized Fe-scintillator calorimeter segmented scint for X, Y tracking 485 planes, 8m diam, 5400 tons MINOS Far Detector
Raison d’Être for a Northern MinnesotaExperiment! Austin American-Statesman Newspaper, Sunday, April 18, 2004
Neutrino Beams 101: Beam MC i X i i
Focusing peak Consequence: Flux Uncertainty Error (Far/Near) figure courtesy Ž. Pavlović
“High” Energy target Horn 1 Horn 2 Neutrino Beams 102 “Low” Energy proton target Horn 1 Horn 2 Pions with pT=300 MeV/c and p=5 GeV/c p=10 GeV/c p=20 GeV/c Vary n beam energy by sliding the target in/out of the 1st horn figure courtesy Ž. Pavlović
Opportunity: Flexible Beam Energy M. Kostin et al, “Proposal for Continuously- Variable Neutrino Beam Energy,” Fermilab-TM-2353-AD (2002) figure courtesy Ž. Pavlović
Neutrino Beams 103: p+ to far Detector (stiff) target • ND and FD spectra similar, but not identical qf p+ qn (soft) Decay Pipe ND Beam MC Near Detector LE Beam figure courtesy M. Kostin
Ni NNear Consequence: Extrapolating to the FD • ND and FD spectra are similar, but not identical • If they were identical, (NuMI approximating a point source) could say where FN = (Znear/Zfar)2 Far Detector MC Near Detector MC (×1.2×10⁻⁶)
Extrapolating to the FD (cont’d) • The ND sees the NuMI beam as an extended line source of neutrinos, while FD sees a point source, where En 0.43 Ep. • Better than this need a MC to evaluate FN. • Angular correlations in decay • Pi’s that interact before decaying Edge of Decay Pipe Horn 1 neck weighted by p lifetime Horn 2 neck solid angle FN NuMI Beam MC
backgrounds event identification calibration MINOS Decided to Pursue a “Blind Analysis” Policy beam flux near-far extrapolation interpretation fitting Blind Analysis Procedure Intensive checks of ND data neutrino interaction identification in ND & FD backgrounds, efficiencies, etc. beam modeling – how well can we extrapolate flux measured in ND to the expected flux in the FD?? Much to be learned from the ND Data Not much statistics in the FD Not much to learn Opportunity to bias ourselves
Step 1: Look at ND Data • Hope no gross disagreements with beam MC • See if neutrino identification is OK
ND Events Observed First Observed Neutrino Events in Near MINOS Detector January 21, 2005 nm + Fem+ + X
Neutral Current nm Backgrounds MINOS MC CC (no osc.) • Analysis requires an energy spectrum measurement. • In nm+Fem+ + X interaction, reconstruct En=pm+EX, • Can’t see full neutrino energy in NC nm+Fenm + X interactions. Hypothetical MINOS Data CC (with osc.) NC Background Visible Neutrino Energy (GeV)
Slice 1 Slice 2 Slice 3 Slice 4 Slice 5 In one slice Coping with High Intensity • 10-20 events/spill in the ND (cf 10-4/spill in the FD!) In one spill (51012 ppp) Time (msec)
June • July • August • September • October • November Beam is Stable
ND Compared to Beam MC “High” Energy Beam Setting • These plots show the beam spectrum as “dead reckoned” by Fluka2005 + our tracking MC through the beam line. • Errors bars from the beam systematics (dominated by p/K production in the target). • Some real apparent contradictions? MC is low in the LE beam, but high in the ME beam. “Medium” Energy Beam Setting “Low” Energy Beam Setting MINOS Data Calculated n flux figure courtesy P. Vahle
ND Spectra After Tuning figure courtesy Ž. Pavlović, P. Vahle
Step 2: Decide How to Extrapolate ND FD • FD Spectrum = (F/N ratio) ND Spectrum NEn = Number of events at given energy of neutrino in ND or FD i = particular energy bin • Tests on “mock data” to ensure no biases, understand systematics
Alternative Extrapolation“Matrix Method” A. Para & M. Szleper, arXiv:hep-ex/0110032
Checks of the Fitting • MC “Mock data sets” • 100 experiments • each 1020 POT exposure • Studies of • biases • statistical precision figures courtesy D. Petyt Best Fit Dm2 (eV2) Best Fit sin2(2q) Best Fit c2
Step 3: Peek at the Far Detector Data( “Box is still closed”) In 2006 analysis, question was “Do n’s disappear?” unknown “blinding function” to hide most of the data Collaborators given free access to “open” data set Only got to see full data set once “box was open” In 2007 analysis, want unbiased Dm2, sin2(2q) measurement Access to all the data, but complete blinding of all rates Did not look at energy spectrum, so couldn’t bias Dm2
Checks on the FD Data • These are all CC neutrino events • Rates blinded – we don’t know the normalization • MC has been scaled to agree with data Track Vertex in X (m) Track Vertex in Y (m) Track Vertex in Z (m)
Calibration • Calibratrions based on stopping cosmic ray m’s. • Study ionization for 20-plane window upstream of stopping m location. region used for calibration figure courtesy N. Tagg
Example Events (I) • These events taken from the “open” data sample in the FD (which we are permitted to look at in detail). • En = 3.0 GeV • y = Ehad/En=0.3
Example Events (II) • These events taken from the “open” data sample in the FD (which we are permitted to look at in detail). • En = 24.4 GeV • y = Ehad/En=0.4
Example Events (III) • These events taken from the “open” data sample in the FD (which we are permitted to look at in detail). • En = 10.0 GeV • y = Ehad/En=0.3
Example Events (IV) • These events taken from the “open” data sample in the FD (which we are permitted to look at in detail). • En = 2.1 GeV • y = Ehad/En=0.1 (‘quasi-elastic’?)
Example Events (V) • These events taken from the “open” data sample in the FD (which we are permitted to look at in detail). • En = 18.7 GeV • y = Ehad/En=0.9
Example Events (VI) • These events taken from the “open” data sample in the FD (which we are permitted to look at in detail). • En = 3.3 GeV • y = Ehad/En=0.6