Download
1 / 16
170 likes | 310 Vues
Improved Spatial Reuse Feasibility – Part II. Date: 2014-01-20. Authors:. In 802.11-14/0082r0 (“ Improved Spatial Reuse Feasibility – Part I”) we provided initial PHY system simulation results In this follow-up presentation, we provide further detail on two topics:

E N D
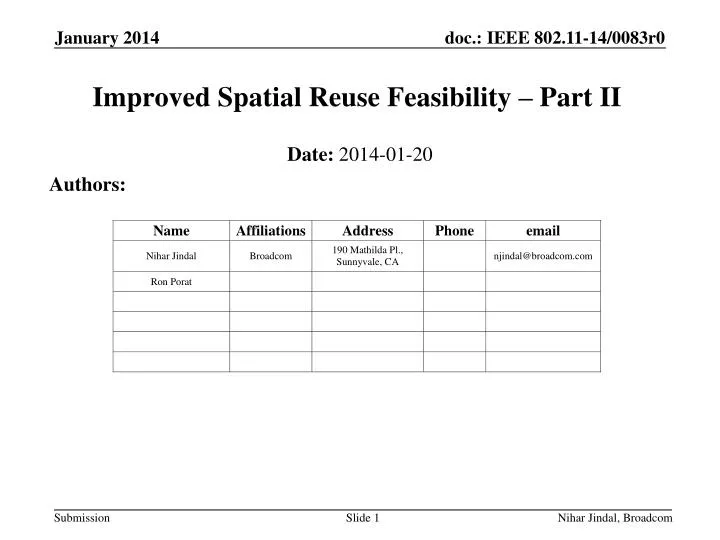
Improved Spatial Reuse Feasibility – Part II Date: 2014-01-20 Authors: Nihar Jindal, Broadcom
In 802.11-14/0082r0 (“Improved Spatial Reuse Feasibility – Part I”) we provided initial PHY system simulation results • In this follow-up presentation, we provide further detail on two topics: • Summation of wall and floor losses • MCS selection Introduction Nihar Jindal, Broadcom
Literature suggests that summation of losses is sub-linear [1][2] • From COST 231, loss from N floors is N^((N+2)/(N+1)-0.46) * K, where K is the floor loss • Important to note that wall/floor loss factors are not measured physical wall losses, but instead are coefficients chosen to fit measurement data Summation of Wall & Floor Losses Nihar Jindal, Broadcom
Compare 2 different methods: • Sub-linear summation of wall losses, sub-linear summation of floor losses, linear summation of total wall and total floor • Sub-linear summation of all losses, with 14.5 dB per wall and floor • Method requires single coefficient for wall and floor loss • If wall=floor loss, L1 > L2 • Method 1 used in earlier presentation (802.11-14/0082r0) Summation of Wall & Floor Losses (2) Nihar Jindal, Broadcom
RX Power CDF • CDF of RX power at middle AP (center of middle floor) from other AP’s, assuming 23 dBm TX power • # of AP’s above -90 significantly larger for method 2 compared to method 1 Nihar Jindal, Broadcom
Penetration Loss Summation - Results • 50/50 DL/UL traffic, random AP, 1 channel • Smaller penetration loss for method 2 leads to higher interference, and lower absolute throughput • Throughput difference is particularly large with -90 dBm threshold, due to the large difference in # of nodes seen above -90 dBm • Smaller throughput difference when CCA threshold is higher • Large throughput difference with -90 dBm threshold leads to large difference in multiplicative gain Nihar Jindal, Broadcom
For scenario 1, we feel that wall and floor losses are similar, and so we feel method 2 (sub-linear summation of all losses) is appropriate Scenario 2 (enterprise, wireless office) currently only has a single floor (with 8 x 64 STA’s) and 7 dB cubicle wall loss. We feel this scenario should be extended to multi-floor, in which case floor and wall (cubicle) losses will be quite differentand thus method 1 is needed Proposal Nihar Jindal, Broadcom
Required SNR per MCS defined by Shannon capacity with 7 dB gap (4 dB from BCC, 3 dB implementation loss): Genie MCS: find highest MCS supportable based on per-TX event SINR Fixed MCS: MCS for a flow is the MCS supportable with SNR = (interference-free SNR –margin) With genie MCS, a flow can have a different MCS for different TX events. Throughput is the rate averaged across all TX events. With fixed MCS, a flow has the same MCS for every TX event (within a drop). Throughput is defined as the goodput = TX rate of assigned MCS X success probability of assigned MCS MCS Selection (from Part I) Nihar Jindal, Broadcom
Genie MCS is overly optimistic because it presumes knowledge of the instantaneous SINR. • Choosing MCS based on interference-free SNR is overly pessimistic and not sufficiently adaptive • Objective is to find an MCS selection scheme that is simple yet realistic • Consider two SINR statistics based MCS selection schemes: • Goodput-maximizing MCS: based on flow’s SINR statistics, find MCS that maximizes goodput=(1-PER)*rate • 10% PER MCS: find highest MCS such that PER <= 10% • For both schemes, a particular flow uses a single MCS for all TX events within a drop Alternative MCS Selection Schemes Nihar Jindal, Broadcom
MCS Selection Example • Consider single AP->STA flow, for network with -55 dBm interference threhsold • Link was active in 625 out of 1000 TX events • SINR distribution during those 625 TX events shown below right • PER and goodput per MCS (assuming cliff wall PER curves): • Selected MCS and average rate of different methods: Nihar Jindal, Broadcom
Goodput-max and 10%PER methods require knowledge of SINR and/or PER per MCS statistics to determine MCS • Statistics can be based on: • All TX events in a drop • Warmup period: first X TX events (per flow) in a drop, e.g., with X = 50 MCS Selection Warmup Period Nihar Jindal, Broadcom
Random AP placement, 1 channel, 100% DL traffic • Compare following schemes: • Genie MCS • Fixed MCS based on interference-free SNR with 6 dB margin • Always selects MCS8 due to very high interference-free SNR • Goodput-max MCS • Based on all TX events • Based on 50 event warmup period • 10% PER MCS • Based on all TX events • Based on 50 event warmup period Comparison of MCS Selection Schemes Nihar Jindal, Broadcom
Comparison of MCS Selection Schemes (2) Nihar Jindal, Broadcom
Ordering in terms of absolute throughput and multiplicative gain: • Genie > goodput-max > 10% PER > Int-free SNR • All schemes give same baseline (-90 dBm threshold) results • All active links operate at MCS8 • SNR-based MCS selection performs very poorly in terms of mean and 5% tput with high CCA threshold • Compared to goodput-max MCS, 10% PER MCS gives reasonable mean throughput but significantly lower 5% tput with high CCA • No noticeable difference between goodput-max MCS using warmup versus using all TX events • See same behavior for other combinations of central/random AP, 1 vs. 3 channels, DL vs DL/UL traffic Observations Nihar Jindal, Broadcom
Use goodput-maximizing MCS as baseline MCS selection method • Achieves the desired balance of simplicity and realism Proposal Nihar Jindal, Broadcom
[1] “Digital mobile radio towards future generation systems, final report,” COST Action 231, European Communities, EUR 18957, Tech. Rep., 1999. [2] Zyoud et. al., Comparison of Empirical Indoor Propagation methodlsfor 4G Wireless Networks at 2.6 GHz, Int. Conf. on Control, Engineering, & Information Technology References Ron Porat, Broadcom