Download
1 / 15
150 likes | 371 Vues
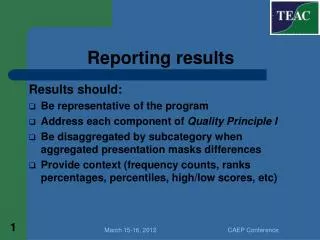
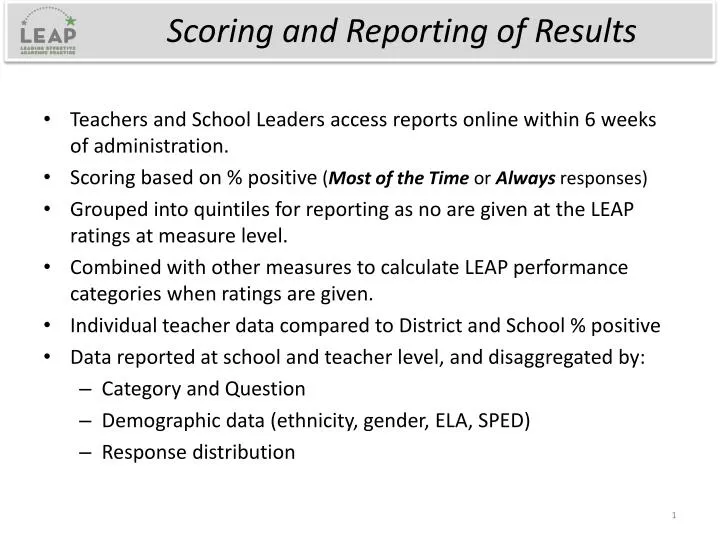
Scoring and Reporting of Results. Teachers and School Leaders access reports online within 6 weeks of administration. Scoring based on % positive ( Most of the Time or Always responses) Grouped into quintiles for reporting as no are given at the LEAP ratings at measure level.

E N D
Scoring and Reporting of Results • Teachers and School Leaders access reports online within 6 weeks of administration. • Scoring based on % positive (Most of the Time or Always responses) • Grouped into quintiles for reporting as no are given at the LEAP ratings at measure level. • Combined with other measures to calculate LEAP performance categories when ratings are given. • Individual teacher data compared to District and School % positive • Data reported at school and teacher level, and disaggregated by: • Category and Question • Demographic data (ethnicity, gender, ELA, SPED) • Response distribution
Supports, Alignment, and Next Steps • Teachers discuss results with school leaders in mid-year conversations. • Results are a part of a holistic conversation that encompasses all LEAP data to date, including Observation and Professionalism. • Recommendations and guiding questions provided to school leaders, team leaders, and teachers in training materials (how to look at results in the context of other LEAP data). • Data analysis of alignment to other measures is ongoing. • Teachers who received additional Observation support though Differentiated Teacher Leaders saw a 1% average increase in scores over expected, the Teacher Leaders saw a 2% average increase. • Next steps: • Best practice recommendations and materials for involving students more deeply • Formal Professional Learning materials correlated directly to Student Perception Survey results
Survey Alignment with MET Source: Asking Students about Teaching: Student Perception Surveys and their Implementation (2012)
Engaging Students in the Educator Effectiveness Conversation: Building a Robust Student Perception Survey Amy Farley, Director, Research and Impact Colorado Legacy Foundation
Overview • Why use a Student Perception Survey? • What the Research Says • Survey Overview • Survey Development • Pilot Results • Survey Administration • Use of Survey Results
Why Use a Student Perception Survey? • The survey is a unique form of actionable feedback that districts, schools and teachers can use to inform practice. • Students are in aunique position to contribute to a comprehensive view of classroom practice because they experience it more than anyone else in the education system. • Student perception data can offer a big-picture view of what is happening in classrooms as well as school- and district-wide trends.
What the research says… • The Measures of Effective Teaching (MET) Project had two significant findings around student perception surveys: • When student surveys are combined with observation and student growth data, these three measures tell us more and are able to predict future effectiveness better than any of them alone. • Student perception survey results are correlated to student achievement gains. • The use of student feedback has also been shown to promote both reflection and responsibility on the part of the students. Research overview Bill and Melinda Gates Foundation (2012). Asking students about teaching: Student perception surveys and their implementation. (MET Project Policy and Practice Brief). Retrieved from http://www.metproject.org/downloads/Asking_Students_Practitioner_Brief.pdf Wiggins, G. (2011). Giving students a voice: The power of feedback to improve teaching. Education Horizons, 89(3), 23-26.
Colorado’s Student Perception Survey • Free and publically available. • 34-item survey about student learning experiences. • Two versions of the survey, grades 3-5 and 6-12 • Developed by the Colorado Legacy Foundation • Input from more than 1,400 teachers • Piloted in 16 Colorado districts • Rigorous analyses confirm that the survey is fair, valid, and reliable • The survey maps to Colorado’s Teacher Quality Standards. • Full Technical Report
What does the survey measure? • Survey does measure elements of student experience that have been demonstrated to correlate most closely to student growth. • Survey does not measure whether or how much a student likes or dislikes a teacher.
What does the survey measure? See the full surveys for grades 3-5 and 6-12 Standards I and III Standard II Standard II Standard II
Student Feedback • Students participated in “think-alouds” where they talked through their responses to each question. • Students responded thoughtfully. • In my class, we learn things that matter to me: “She made the people who speak Spanish feel more important because we participated… we could teach about our culture. [It] taught us to trust in ourselves.” • My teacher knows when we understand the lesson and when we do not: “I say most of the time… one of my friends didn’t understand and when she asked if we all understood, he didn’t say anything [and she didn’t know and kept on going]”
Teacher Feedback • Over 1400 teachers provided input during the survey development process. • Focus groups, survey pre-piloting, online feedback forums • We took feedback about the instrument very seriously. • Items were changed or eliminated for specific reasons. For example between the fall and spring administration: • The item “I get bored in this class” was removed because many teachers found it troubling • “Schoolwork in this class is too easy” was removed because it was not related to students’ responses on other items.
Revisions to the Colorado SPS • Removed all negatively-stated items • The fall 2012 instrument included a handful of negatively-worded items • All were removed from the final SPS instrument. • Redefined organizing elements (four mapped to TQS) • Included open-ended question
Summary of Findings: Teacher-Level Figure 1. Overall teacher mean score v. percent favorable