Download
1 / 1
10 likes | 223 Vues
On Randomness Measures for Social Networks Xiaowei Ying, Xintao Wu University of North Carolina at Charlotte. Abstract

E N D
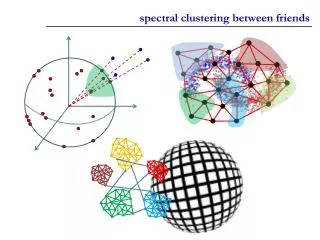
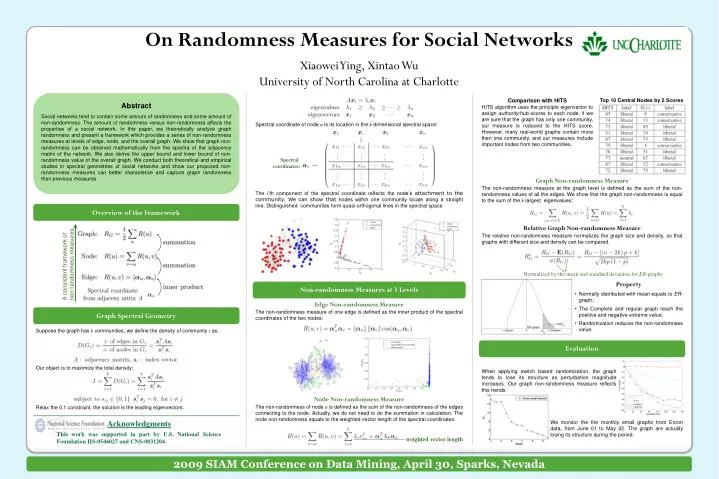
On Randomness Measures for Social Networks Xiaowei Ying, Xintao Wu University of North Carolina at Charlotte Abstract Social networks tend to contain some amount of randomness and some amount of non-randomness. The amount of randomness versus non-randomness affects the properties of a social network. In this paper, we theoretically analyze graph randomness and present a framework which provides a series of non-randomness measures at levels of edge, node, and the overall graph. We show that graph non-randomness can be obtained mathematically from the spectra of the adjacency matrix of the network. We also derive the upper bound and lower bound of non-randomness value of the overall graph. We conduct both theoretical and empirical studies in spectral geometries of social networks and show our proposed non-randomness measures can better characterize and capture graph randomness than previous measures Comparison with HITS HITS algorithm uses the principle eigenvector to assign authority/hub scores to each node. if we are sure that the graph has only one community, our measure is reduced to the HITS score. However, many real-world graphs contain more then one community, and our measures include important nodes from two communities. Top 10 Central Nodes by 2 Scores Spectral coordinate of node u is its location in the k-dimensional spectral space: Spectral coordinates: The i’th component of the spectral coordinate reflects the node’s attachment to the community. We can show that nodes within one community locate along a straight line. Distinguished communities form quasi-orthogonal lines in the spectral space Graph Non-randomness Measure The non-randomness measure at the graph level is defined as the sum of the non-randomness values of all the edges. We show that the graph non-randomness is equal to the sum of the k largest eigenvalues: Relative Graph Non-randomness Measure The relative non-randomness measure normalizes the graph size and density, so that graphs with different size and density can be compared. Overview of the Framework A consistent framework of non-randomness measures Normalized by the mean and standard deviation for ER-graphs • Property • Normally distributed with mean equals to ER-graph; • The Complete and regular graph reach the positive and negative extreme value; • Randomization reduces the non-randomness value. Non-randomness Measures at 3 Levels Edge Non-randomness Measure The non-randomness measure of one edge is defined as the inner product of the spectral coordinates of the two nodes: Node Non-randomness Measure The non-randomness of node u is defined as the sum of the non-randomness of the edges connecting to the node. Actually, we do not need to do the summation in calculation. The node non-randomness equals to the weighted vector length of the spectral coordinates: weighted vector length Graph Spectral Geometry Suppose the graph has k communities, we define the density of community i as: Our object is to maximize the total density: Relax the 0,1 constraint, the solution is the leading eigenvectors. Evaluation When applying switch based randomization, the graph tends to lose its structure as perturbation magnitude increases. Our graph non-randomness measure reflects this trends. Acknowledgments This work was supported in part by U.S. National Science Foundation IIS-0546027 and CNS-0831204. We monitor the the monthly email graphs from Enron data, from June 01 to May 02. The graph are actually losing its structure during the period. 2009 SIAM Conference on Data Mining, April 30, Sparks, Nevada