Download

1 / 36
360 likes | 489 Vues
Temperature Records for Asbury Park, New Jersey. Created by:. Rognac Lewis. Asbury Park’s Climate. There are 5 climate regions in New Jersey. Asbury Park is in the coastal zone. N.J. Coastal Climate. The ocean influences our weather.

E N D
Created by: • Rognac • Lewis
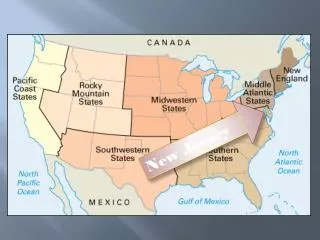
Asbury Park’s Climate • There are 5 climate regions in New Jersey. Asbury Park is in the coastal zone.
N.J. Coastal Climate • The ocean influences our weather. • In autumn and early winter our climate will be warmer due to warm ocean water. • In Spring the cold ocean water will keep the temperatures cooler in Asbury Park. • Sea breezes can also change our weather.
January is usually the coldest month with average temperatures in the mid 30’s • August is usually the warmest month with the average temperature at 80 degrees, but cooler near the ocean
Average temperatures for Asbury Park, NJ Source: http://www.city-data.com/city/Asbury-Park-New-Jersey.html
Step 1 • We look up the high/low temperatures using AOL weather forecast for Asbury Park.
Step 2 • We enter the data on the EXCEL chart we made.
Step 3 • On Fridays we lead a class in interpreting the chart and computing the mean, mode, median, and ranges in temperatures.
Sample Math Worksheet • 1. What was the mean (average) low temperature for the week? • 2. What was the mean (average) high temperature for the week? • 3. What day had the highest temperature? • 4. what day had the lowest temperature? • 5. What was the mode? • 6. What was the median temperature? • 7. What was the range in temperatures?
The following pages show the graphs for the weather for each week. • We also converted the Fahrenheit temperatures to Celsius since this is used in many other countries. We used www.apples4theteacher.com or • www.onlineconversion.com/temperature.htm temperature conversion calculator to do this. You can also use this equation for the conversions: C=5/9(F-32)
January’s Weather Analysis • The temperatures in Asbury Park were above average for the month of January 2006.
February’s Weather Analysis • The temperature in February 2006 were warmer this year then the average temperatures for this month.
March’s Weather Analysis • In March the temperatures were warmer this year, 2006, than in the past.
April’s Weather Analysis • The temperature was about the same as the last years average.
May’s Weather Analysis • The temperature was about the same as the last years average.