Download
1 / 20
210 likes | 323 Vues
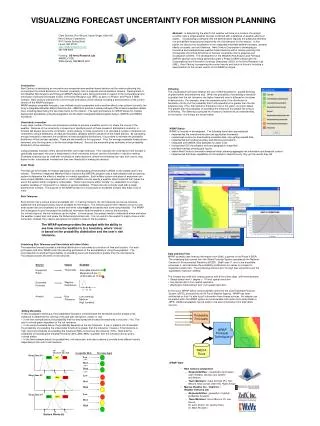
Assessing Forecast Uncertainty in the National Digital Forecast Database. AMS Weather Analysis and Forecasting Matt Peroutka, Greg Zylstra, John Wagner NOAA/NWS Meteorological Development Lab August 1, 2005. National Digital Forecast Database (NDFD).

E N D
Assessing Forecast Uncertainty in the National Digital Forecast Database AMS Weather Analysis and Forecasting Matt Peroutka, Greg Zylstra, John Wagner NOAA/NWS Meteorological Development Lab August 1, 2005
National Digital Forecast Database (NDFD) • Contains a mosaic of NWS digital forecasts • Is available to all users and partners – public and private • Allows users and partners to create wide range of text, graphic, and image products
How is NDFD Produced? National Centers Model Guidance • Detailed • Interactive • Collaborative Grids Local Digital Forecast Database Field Offices National Centers Collaborate Data and Science Focus NWS Automated Products User-Generated Products National Digital Forecast Database TODAY...RAIN LIKELY. SNOW LIKELY ABOVE 2500 FEET. SNOW ACCUMULATION BY LATE AFTERNOON 1 TO 2 INCHES ABOVE 2500 FEET. COLDER WITH HIGHS 35 TO 40. SOUTHEAST WIND 5 TO 10 MPH SHIFTING TO THE SOUTHWESTEARLY THIS AFTERNOON. CHANCE OF PRECIPITATION 70%. Digital Text Graphic Voice
Single-valued Forecasts • Most NDFD weather elements are single-valued • Can be viewed as a limitation • Forecast uncertainty information can enhance customer decision processes
Numeric Uncertainty Assessment of NDFD via Climatology and Ensembles (NUANCE)
Development and Implementation • Development • Amass observation (x) and forecast (f) pairs • Model joint distribution, p(f,x) • Refine with diagnostic data (d) to form p(f,x,d) • Implementation • Use current values of f and d, and p(f,x,d) • Infer conditional distribution of observations, p(x|f,d)
Data Sources • Ideally, NDFD grids and Analysis of Record • Prototype with NDFD point forecasts and METAR observations • Ensemble MOS (ENSMOS) archives • One set of forecasts from control run • Five sets of forecasts created from runs with positive perturbations • Five sets of forecasts created from runs with negative perturbations
Diagnostic Data • Standard Deviation (SD) of 11 ENSMOS forecasts. • “Ensemble Deviation” (ED) • Difference each perturbed forecast with control forecast • Compute root mean square
Transformation to Percentiles • Useful to transform both f and x from native values to climatological percentiles • Data from U. S. Historical Climatology Network (USHCN) • Addresses lack of extreme cases in development data • Encourages combining of data • NDFD has a short history • Expect p(f,x) to vary by region and by forecast
Results: Transformation to Percentiles • Obtained daily maximum temperature (MaxT) observations for 168 stations from USHCN • Computed percentile function at 5-day intervals throughout the year • Used Generalized Lambda Distribution to model percentile function • Percentile function fitted to observations. • Fit parameters expressed as cosine series over day of the year. • Quality of fit judged subjectively. • Additional terms added to cosine series, if needed.
Results of Percentile Transform Technique for Blythe, California
Comparison of MaxT Percentiles Baudette, Minnesota (KBDE; blue) Fort Lauderdale, Florida (KFLL; purple) Blythe, California (KBLH; red)
Day 1 vs. Day 7 • Day 1 forecasts verify better • Day 7 points cluster around the 0.50 forecast value more • Fewer extreme forecasts on Day 7
Results: Diagnostic Data • Day 7 forecasts, stratified by Ensemble Deviation. • ED < 6° F (above) vs. ED ≥ 6° F (below). • Suggests more skillful forecasts when ED < 6° F, but relationship is not obvious.
Future Plans • Quantitatively assess uncertainty • Expand to include minimum temperature • Work with grids • Prototype experimental guidance products