Download
1 / 20
200 likes | 212 Vues
The relative contributions of radiative forcing and internal climate variability to the late 20 th Century drying of the Mediterranean region Colin Kelley, Mingfang Ting, Richard Seager, Yochanan Kushnir Department of Ocean and Climate Physics Columbia University, New York NY.

E N D
The relative contributions of radiative forcing and internal climate variability to the late 20th Century drying of the Mediterranean region Colin Kelley, Mingfang Ting, Richard Seager, Yochanan Kushnir Department of Ocean and Climate Physics Columbia University, New York NY
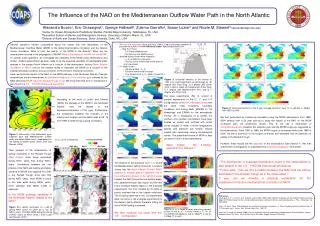
Strong drying of the Mediterranean region occurred from the 1960s to the 1990s (extended winter Nov-Apr)
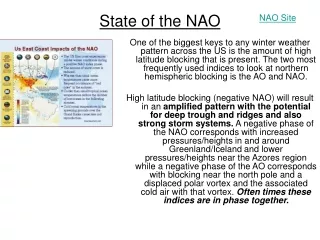
NAO During the same period the NAO trended strongly positive
The NAO and Mediterranean drying are highly correlated (~0.7 over the century), with the NAO explaining nearly half of the extended winter precipitation variance.
Did external radiative forcing in the form of global warming play an important role in the strong positive NAO trend, as suggested by Shindell et al. (1999), Feldstein (2002) and Osborn (2004), and by extension the drying of the Mediterranean region? Or were the strong trends predominantly a result of low frequency natural variability on decadal to interdecadal timescales (Schneider et al. 2003; Thompson 2003)? How well can the models produce multidecadal trends of realistic magnitude? Can we through use of S/N maximization EOF use the models to obtain a best estimate of the model-derived signal and use it to attribute and quantify the externally forced portion of the NAO and Mediterranean drying trends? How does this attribution project onto the 21st century? Questions
The mechanisms that influence Mediterranean rainfall variability include both dynamical and thermodynamical processes. The region is located in the subtropical dry zone, characterized by the poleward flank of the Hadley Cell and moisture divergence by the mean flow. The primary mechanisms whereby anthropogenic warming could cause drying include: 1) increases in specific humidity leading to intensified water vapor transports that, in regions of existing mean flow moisture divergence, such as the subtropics in general and the Mediterranean in particular (Held and Soden 2006; Seager et al. 2007, 2010) will cause further drying, 2) the poleward expansion of the Hadley Cell (Lu et al. 2007) and 3) the northward migration of the northern hemisphere storm track (Yin 2005; Lu et al. 2007, Wu et al. 2010). The dominant influence on Mediterranean rainfall variability however, particularly during winter when the vast majority of precipitation occurs, is the NAO (Hurrell et al. 2003). Mechanisms of Mediterranean drying
From Feldstein 2002 Observed NAO trend 1965-95 = 1.56 hPa Observed trend in AO Index 1967-97 = 5.7 Using 64 runs from 19 coupled models, we show that the observed NAO trend from 1965-95 is within the span of model simulated NAO trends, but that models trends of similar magnitude to the strong observed trend are rare. Using a Markov model, Feldstein shows that an atmospheric model decoupled from the hydrosphere/cryosphere is almost incapable of producing trends of magnitude similar to the observed trend from 1967-97
Using seven coupled climate models Osborn concludes that… …the NAO increase from the 1960s to the 1990s is not compatible with either the internally generated variability nor the response to increasing greenhouse gas forcing simulated by these models. The model simulations imply greenhouse gas forcing contributed to the observed NAO index increase from the 1960s to the 1990s, unless the climate models are deficient in their simulation of inter-decadal NAO variability or their simulation of the response to greenhouse gas forcing. It is possible, therefore, that the observed record can be explained as a combination of internally generated variability and a small greenhouse-gas-induced positive trend. This is supported by the more recent (strong) downturn in the NAO index after the mid-1990s, which might be a reversal of an internally generated variation. Osborn 2004
Comparison of observed and modeled low frequency (decadal or longer) NAO variability, using six commonly used coupled models at left and all 19 models at right.
We use signal-to-noise maximization EOF on an ensemble of runs from 19 models to obtain a best estimate of the externally forced signal (for NA SLP and Mediterranean precipitation) that the models have in common. After we calculate the forced signal (PC1 of S/N EOF) we regress the original data fields of SLP and precipitation onto it for the entire 20th century, obtaining spatial patterns of the forced regression coefficients (α). We obtain the magnitude of the externally forced SLP or precipitation at each gridpoint and time (x,y,t) (reconstruct the field) by multiplying the regression coefficients by the 20th century signal (PC1), and then subtract the reconstructed externally forced field from the total field to get the residual. α(x,y) is the regression coefficient SLP(x,y,t) is the total observed SLP SLP*(x,y,t) is the externally forced SLP SLPresid(x,y,t) is the residual SLP Methodology
The strong positive trend began several decades ago Signal (With and without 9-yr low pass filter)