Download
1 / 22
220 likes | 230 Vues
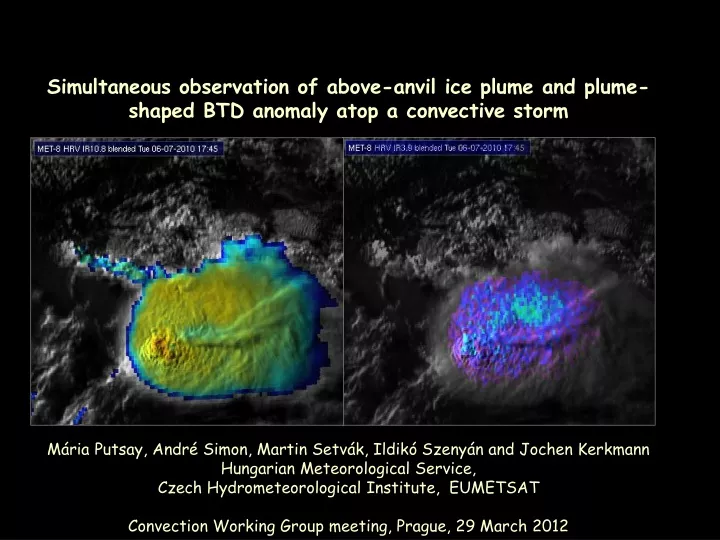
Simultaneous observation of above-anvil ice plume and plume-shaped BTD anomaly atop a convective storm Mária Putsay, André Simon, Martin Setvák, Ildikó Szenyán and Jochen Kerkmann Hungarian Meteorological Service, Czech Hydrometeorological Institute, EUMETSAT

E N D
Simultaneous observation of above-anvil ice plume and plume-shaped BTD anomaly atop a convective storm Mária Putsay, André Simon, Martin Setvák, Ildikó Szenyán and Jochen Kerkmann Hungarian Meteorological Service, Czech Hydrometeorological Institute, EUMETSAT Convection Working Group meeting, Prague, 29 March 2012
observations: 1 Above penetrating storm top the BTD (WV6.2-IR10.8) is often positive, in other areas it is typically negative. 2 In most of the cases the BTD distribution and the IR10.8 BT distribution above the storm top are spatially correlated. BTD maxima and IR10.8 BT minima are co-located. That is why BTD is often used to detect OTsor penetrating clouds. However, in some cases this method can fail because BTD maxima and BT minima are not always co-located. >> such cases are called BTD anomaly I will present a storm with BTD anomaly. In that case BTD anomaly was detected in close proximity to anice plume.
What is the physical background? Why could be the BTD positive atop penetrating storm tops? Emissivity / transparency effects (ice particles):Older anvils seem to have higher transparency at their tops (smaller ice particle size and/or lower particle concentrations) >> itcancausepositive BTD. After Martin Setvak Higher-elevated thin layer of ice or aerosols above storm tops:In some cases, it is possible to observe very thin layers of ice particles or aerosols well above the storm tops. Their presence may also contribute to the BT difference between the two bands due to the transparency and/or scattering effects.
Why could be the BTD positive atop penetrating storm tops • thermal inversion + moisturelayer above the storm top >> positive BTDs • thermal inversion + uniform layer of moisture above the storm top >> positive BTDs, • AND max BTDs and min BTs are spatially correlated After Martin Setvak • thermal inversion + non-uniform (either in concentration or in temperature) layer of moisture • above the storm top >> positive BTDs, BUT max BTDs and min BTs are NOT spatially correlated
WISCDYMM model simulation by Pao K. Wang Gravity wave breaking From Wang, 2007: The thermodynamic structure atop a penetrating convective thunderstorm. Atmos. Res., 83, 254-262. White contours – potential temperature Black arrows – wind vectors Colors– relative humidity Note: the model results do not distinguish phase of the humidity generated into the lower stratosphere. Can be both: ice particles (above-anvil ice plumes, seen directly in most of the satellite bands), or water vapor, detectable for example by the BTD (WV – IR window) method.
06 JULY 2010, NORTH ITALY Long-lived ice plume Udine TEMP, thermal inversion
16:30 UTC HRV/IR10.8 blended image BTD (WV6.2-IR10.8) image HRV/BTD blended image The longer-lived ice plume started to evolve at about 16:20-16:25 At 16:30 UTC higher BTD values started to appear At this early stage BTD and IR10.8 BT fields were correlated, indicating (more or less) a pre-existing (uniform) moist layer above the storm. Highest BTD values are above the OT.
16:50 UTC High BTD values appear on the area marked by the circle. Here the BTDs have about the same magnitude as over OT, while the IR10.8 BT is warmer here. The BTD anomaly region is located north from the ice-plume. Note that south of the ice plume we have no high BTD although the IR10.8 BT temperature is about the same as in the area of BTD anomaly.
17:05 UTC the north-east BTD anomaly begins to elongate, starting to resemble a plume – well visible in the next slide (at 17:10). Still, the south edge of this BTD anomaly just correlates with the north outline of the warmer ice plume.
17:10 UTC Here begins the BTD anomaly resembling a moisture (???) plume.
17:15 UTC Here the BTD plume-like anomaly extends parallel just north of the ice-plume. If it is indeed a moisture plume, the distinction between these two plumes might be in their altitude, deciding about their phase …
17:40 UTC the shape, extent and position of the BTD anomaly have nothing common with the ice-plume. The BTD anomaly extended above the plume area
17:55 UTC The part of the ice plume close to its origin (its “source”) begins to be irregular, indicating that the mechanism generating it begins to weaken.
18:05 UTC Another “burst” of high BTD values. Nothing matching this BTD anomaly in the sandwich product. Also, the ice plume seems to strengthen here again.
18:20 UTC The young cell at the south-west exhibits only very low BTD values … In cases like this one the BTD method when used for OT (or precipitating clouds) detection would completely fail, missing the active parts of the storm.
Local BTD anomalies can be explained by • local emissivity/transparency effects, or • locally higher amounts of the moisture above storm tops, or • locally higher temperature of the moisture above storm tops • We do not know which mechanism(s) caused the BTD anomaly in the presented case. • Which one is more likely? • 3) we do not know what could cause it • We cannot exclude it. However, we have not found any trace neither in anvil top morphology, nor in IR3.9 imagery nor in other BTD differences: BTD (IR13.4-IR10.8), BTD (IR9.7-IR13.4). • 2) most likely - theory - The BTD plume (when present) was oriented • similarly as the ice plume. IR10.8 1710 UTC BTD (WV6.2-IR10.8) BTD (IR13.4-IR10.8) BTD (IR9.7-IR13.4) HRV/IR3.9 blended image • If the BTD plume was indeed a WV plume injected by the storm, then the distinction between the water-vapor and ice plumes might be either • in their altitude (and thus surrounding temperature, with the ice plume being formed in a cooler environment), or • in the saturation of the environment (the more humid air forming an ice plume), or • in the specifics of the mechanism forming these two plumes. • If it was indeed a moisture plume, it may have been formed by the same mechanism as the longer-lived ice plume - perhaps after the gravity breaking had reached higher levels, where the moisture did not condensate into an ice plume. If so, the ice plume might have formed earlier, when the mechanism was still a bit weaker, reaching lower above-anvil altitudes only.
BTD (WV – IR window) Brightness Temperature Differences (BTD) between satellite Water Vapor (WV) and IR-window bands • Meteosat Second Generation SEVIRI WV6.2– IR10.8 Pioneered by: Fritz and Laszlo (1993) Ackerman (1996) Schmetz et al (1997) Fritz, S., and I. Laszlo, 1993: Detection of water vapor in the stratosphere over very high clouds in the tropics. J. Geophys. Res., 98 (D12), 22959-22967. Ackerman, S. A., 1996: Global satellite observations of negative brightness temperature differences between 11 and 6.7 micron. J. Atmos. Sci., 53, 2803-2812. Schmetz, J., S. A. Tjemkes, M. Gube, and L. van de Berg, 1997: Monitoring deep convection and convective overshooting with METEOSAT. Adv. Space Res., 19, 433-441. ... and received additional attention namely with launch of the MSG satellites Martin Setvák