Download
1 / 50
500 likes | 647 Vues
A Quantitative Overview to Gene Expression Profiling in Animal Genetics. Gene Networks. Reversed Engineering (data-driven) of Gene (Regulatory) Networks from Expression Data. Armidale Animal Breeding Summer Course, UNE, Feb. 2006.

E N D
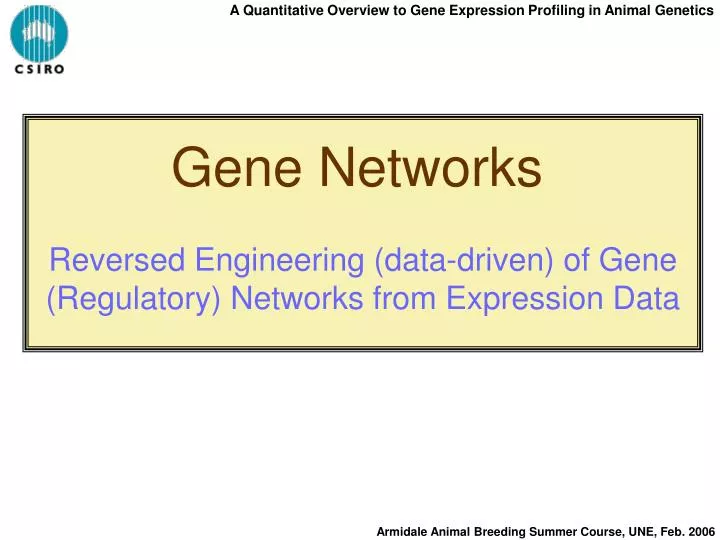
A Quantitative Overview to Gene Expression Profiling in Animal Genetics Gene Networks Reversed Engineering (data-driven) of Gene (Regulatory) Networks from Expression Data Armidale Animal Breeding Summer Course, UNE, Feb. 2006
A Quantitative Overview to Gene Expression Profiling in Animal Genetics Gene Networks Introduction When a comprehensive gene expression data set representing a large number of perturbations is made available, the reversed engineering of gene regulatory networks becomes a logical step towards the elucidation of biological pathways of interest. While developmental (ie. Time series) experiments provide the ideal framework, Basso et al (2005; Nature Genetics, 37:382) showed that, with the right mathematical approach, a large number of perturbations can also do the trick. Barabasi & Oltvai (2004) Network Biology: Understanding the cell’s functional organization. Nature Review Genetics 5:101. “Network theory offers unforeseen possibilities to understand the cell’s internal organization and evolution, fundamentally altering our view of cell biology”. Armidale Animal Breeding Summer Course, UNE, Feb. 2006
A Quantitative Overview to Gene Expression Profiling in Animal Genetics Gene Networks Justification and Concepts Networks contain small repeating patterns of interconnections, called network Motifs. Basic network motifs include: (1) Feed forward; (2) Single input; (3) Multiple input; (4) A combination of the above. Think of motifs as simple building blocks of complex networks. Much of a cell’s activity is organised as a network of interacting Modules: Sets of genes co-regulated to respond to different conditions. Think of Modules as clusters, i.e., genes being highly connected within a cluster but sparsely (if at all) connected across modules. Understanding this organisation is crucial for understanding cellular responses to internal and external signals. Once a network is build, both its (1) Mathematical and (2) Biological soundness needs to be validated. Scale-free, power-law distribution of its connectivity Targets via essays Effects via knock-outs Armidale Animal Breeding Summer Course, UNE, Feb. 2006
A Quantitative Overview to Gene Expression Profiling in Animal Genetics Transcription factor Target gene Basic unit Gene regulatory network of an organism Network motifs Directed graph A transcription factor, a target gene with its binding site and a regulatory interaction Patterns of inter- connections that frequently appear in the network nodes represent genes & edges represent transcriptional interaction Gene Networks Organisation of the gene regulatory network Source: M. Madan-Babu MRC Laboratory of Molecular Biology, Cambridge Armidale Animal Breeding Summer Course, UNE, Feb. 2006
A Quantitative Overview to Gene Expression Profiling in Animal Genetics Gene Networks Motifs MORE TERMINOLOGY: Nodes are Genes. Connections (or edges or vertices or links) are interactions. Directed interactions (ie. having a regulatory nature) involve a Transcription Factor and its Target(s). In the main, we’ll deal with gene co-expression networks (…a way to explore the correlation matrix). Lee et al. (2002). "Transcriptional regulatory networks in Saccharomyces cerevisiae." Science 298:799-804. Armidale Animal Breeding Summer Course, UNE, Feb. 2006
A Quantitative Overview to Gene Expression Profiling in Animal Genetics Gene Networks Connectivity Rules Does this map tell you which cities are important? This one does! The nodes with the largest number of links (connections) are most important! Armidale Animal Breeding Summer Course, UNE, Feb. 2006
A Quantitative Overview to Gene Expression Profiling in Animal Genetics Gene Networks Connectivity Rules Chimp vs Human Gene expression is more strongly preserved than gene connectivity. Hypothesis: Molecular wiring makes us human Additional Hypotheses: 1. Alternative splice variants of the same gene 2. The role of non-coding DNA Armidale Animal Breeding Summer Course, UNE, Feb. 2006
A Quantitative Overview to Gene Expression Profiling in Animal Genetics Gene Networks Network Measures Degree (or Connectivity) of a node, k, is the number of links (edges) this node has. The Degree Distribution, P(k), is the probability that a selected node has exactly k links. Networks are classified by their degree distribution. The Clustering coefficient, C(k) = 2k/(N(N-1)), measures the amount of cohesiveness, the tendency of nodes to form clusters or modules. Note 1: the maximum number of connections is N(N-1)/2 (ie. Number of off-diagonals in the R matrix), in which case C(k) = 1.0. Note 2: For many networks, C(k) ~ k-1 which is an indication of a network hierarchical character (more on this later). Note 3: For a single node i, C(ki) = 2ni/(ki(ki-1)), where ni is the number of links connecting the kineighbours of node i with each other and ki(ki-1)/2 is the total number of triangles that would pass through node i should all of its neighbours be connected with each other. The Path Length = Links we need to pass to travel between two nodes. The mean path length, l tells us the average shortest pass between all pairs of nodes and offers a measure of overall navigability. Armidale Animal Breeding Summer Course, UNE, Feb. 2006
A Quantitative Overview to Gene Expression Profiling in Animal Genetics Gene Networks Three Types of Networks According to their Connectivity Structure • Random Network • Scale-Free Network • Hierarchical Network NB: Biological networks are reported to be Scale-Free Armidale Animal Breeding Summer Course, UNE, Feb. 2006
A Quantitative Overview to Gene Expression Profiling in Animal Genetics Gene Networks Random Networks Each pair of nodes is connected with probability p, creating a graph with approximately p N(N-1)/2 randomly placed links. The connectivity degree follows a Poisson distribution: Nodes that deviate from the average are rare and decreases exponentially. The clustering coefficient is independent of a node’s degree of connectivity, so it appears as a horizontal line. Mean shortest path is l ~ log(N) indicating that most nodes are connected by a short path (Small World Property). Armidale Animal Breeding Summer Course, UNE, Feb. 2006
A Quantitative Overview to Gene Expression Profiling in Animal Genetics Gene Networks Scale-Free (Power Law) Networks Most nodes are poorly while a few are highly connected (Hubs). The degree distribution approximates a power law: P(k) ~ k –γ, where γ is the degree exponent (Straight line in a Log-Log plot). The smaller the γ, the more important is the role of the Hubs. Most biological networks have 2 < γ < 3. For γ > 3, Hubs are irrelevant and the network behaves like a random network. The mean shortest path length is proportional to log(log(N)) (ie. Much shorter than Small World Property). Armidale Animal Breeding Summer Course, UNE, Feb. 2006
A Quantitative Overview to Gene Expression Profiling in Animal Genetics Gene Networks Scale-Free (Power Law) Networks (cont’ed) Line Random Networks, C(k) is independent of k (straight line) Scale-Free networks are invariant to changes in scale. Any function of P(k) remains unchanged within a multiplicative factor P(ak) = b P(k). This implies that scale-free networks are self-similar, i.e. any part of the network is statistically similar to the whole network and parameters are assumed to be independent of the system size. Think of a cauliflower: Armidale Animal Breeding Summer Course, UNE, Feb. 2006
A Quantitative Overview to Gene Expression Profiling in Animal Genetics Gene Networks Random vs Scale-Free Networks • In the random network, the five nodes with the most links (in red) are connected to only 27% of all nodes (green). In the scale-free network, the five most connected nodes (red) are connected to 60% of all nodes (green) Armidale Animal Breeding Summer Course, UNE, Feb. 2006
A Quantitative Overview to Gene Expression Profiling in Animal Genetics Gene Networks Hierarchical Networks To accommodate modularity, clusters combine in an iterative manner, generating a hierarchical network. The hierarchical network model seamlessly integrates a scale-freetopology with an inherent modular structure by generating a network that has a power-law degree distribution with degree exponent γ = 1 + ln4/ln3 = 2.26. The most important signature of hierarchical modularity is the scaling of the clustering coefficient, which follows C(k) ~ k –1 a straight line of slope –1 on a log–log plot. Armidale Animal Breeding Summer Course, UNE, Feb. 2006
A Quantitative Overview to Gene Expression Profiling in Animal Genetics Gene Networks Topology Connectivity, k Clustering Coefficient, C(k) Barabasi and Oltvai (2004)Nat Rev Gen 5:101 Armidale Animal Breeding Summer Course, UNE, Feb. 2006
A Quantitative Overview to Gene Expression Profiling in Animal Genetics Gene Networks Evolution towards Networks AAABG 2005, Noosa, Qld Armidale Animal Breeding Summer Course, UNE, Feb. 2006
A Quantitative Overview to Gene Expression Profiling in Animal Genetics Gene Networks • Background • Lists of DE are being reported for a variety of questions • A “These Go” (Disco?) analysis is suboptimal • A Gene Ontology analysis is a (minimum) must • Pairs of genes showing co-expression are likely to belong to the same pathway • Genes regulated by the same transcription factor show higher than average co-expression • Hence, the trend to work on reversed engineering reconstruction of Gene Regulatory Networks (GRN) • Basso et al., 2005, Nat Genet, 37:382 Armidale Animal Breeding Summer Course, UNE, Feb. 2006
A Quantitative Overview to Gene Expression Profiling in Animal Genetics Gene Networks • Background (cont’d) • The Beef CRC has explored a (reasonably) large number of perturbations • A method, anchored in MME, has been devised to jointly analyse seemingly independent experiments (JAS, 2004, 82:3430) and to compute co-expression measurements (Bioinformatics, 2005, 21:1112). Objective To resort to the above-mentioned data and method to reversed engineer a gene regulatory network for Bovine skeletal muscle Armidale Animal Breeding Summer Course, UNE, Feb. 2006
A Quantitative Overview to Gene Expression Profiling in Animal Genetics Gene Networks Validation of alternative methods of data normalization in gene co-expression studies. Bioinformatics 2005, 21:1112 A. Reverter, W. Barris, S.M. McWilliam, K.A. Byrne, Y.H. Wang, S.H. Tan, N. Hudson, and B.P. Dalrymple Expression of each clone (gene) across 23 conditions Armidale Animal Breeding Summer Course, UNE, Feb. 2006
A Quantitative Overview to Gene Expression Profiling in Animal Genetics Gene Networks Building the Network Step 1 Select Muscle-specific genes (MSG) from the entire SAGE database Step 2 Identify which MSG from Step 1 were surveyed in the Beef CRC studies Step 3 Iteratively extract genes with co- expression > |0.75| with genes from Step 2 Step 4 Identify potential Transcription Factors Step 5 Build the entire network keeping track of emerging modules within the network Step 6 Assess the genomic functionality by significance analysis of gene ontologies Armidale Animal Breeding Summer Course, UNE, Feb. 2006
A Quantitative Overview to Gene Expression Profiling in Animal Genetics Gene Networks Armidale Animal Breeding Summer Course, UNE, Feb. 2006
A Quantitative Overview to Gene Expression Profiling in Animal Genetics Gene Networks NORMAL CANCER Tissue L Genes Extr.G Brain 10 16,123 1 Breast 10 14,684 7 Colon 2 8,388 29 Kidney 1 6,265 31 Liver 2 10,938 113 Lung 3 10,936 30 Ovary 2 9,557 16 Pancreas 3 8,634 82 Peritoneum 1 7,661 27 Placenta 2 11,447 45 Prostate 4 12,180 6 Skin 1 5,687 32 Stomach 2 6,576 49 Thyroid 1 10,232 13 Vascular 2 9,901 7 White BC 1 5,048 9 Lymph 1 11,002 146 Leukocytes 1 5,360 62 Bone 3 10,954 22 Heart 1 7,962 55 Muscle 2 7,588 84 Retina 4 13,881 20 Spinal C 1 8,176 19 Tissue L Genes Extr.G Brain 79 17,925 0 Breast 32 16,847 0 Colon 6 13,888 3 Kidney 3 11,543 23 Liver 3 11,995 13 Lung 6 11,881 15 Ovary 6 13,121 12 Pancreas 6 12,073 22 Peritoneum 1 6,306 41 Placenta 1 8,863 34 Prostate 11 14,313 19 Skin 3 7,853 239 Stomach 4 12,594 8 Thyroid 2 12,617 14 Vascular 2 10,606 9 White BC 3 10,245 61 Cartilage 8 15,147 7 Fibroblast 1 4,343 79 139 Muscle-Specific Genes Armidale Animal Breeding Summer Course, UNE, Feb. 2006
A Quantitative Overview to Gene Expression Profiling in Animal Genetics Gene Networks Muscle-Specific Genes (MSG) SAGE 139 Fast twitch Beef CRC 40 MSG are 10 times more represented in the Beef CRC data than in a comprehensive (whole-system) data set. Slow twitch Armidale Animal Breeding Summer Course, UNE, Feb. 2006
A Quantitative Overview to Gene Expression Profiling in Animal Genetics Gene Networks Fast twitch Muscle-Specific Genes (MSG) Slow twitch Armidale Animal Breeding Summer Course, UNE, Feb. 2006
A Quantitative Overview to Gene Expression Profiling in Animal Genetics Gene Networks Muscle-Specific Genes (MSG) Frequency Expression Armidale Animal Breeding Summer Course, UNE, Feb. 2006
A Quantitative Overview to Gene Expression Profiling in Animal Genetics Gene Networks Building the Network Step 3 Iteratively extract genes with co- expression > |0.75| with genes from Step 2 Step 4 Identify potential Transcription Factors 40 MSG 102 Total Genes 7 Transcription Factors Step 5 Build the entire network keeping track of emerging modules within the network Armidale Animal Breeding Summer Course, UNE, Feb. 2006
|r| > 0.85 BCAR3 SGCA GMPR2 RBBP7 B3GALT4 EEF1D TPT1 DES CREG MYL2 FSTL1 RPL21 CIDEC RPL4 RPL5 FABP4 ITM2B CAV1 RPL11 THRSP EIF3S2 RPL18A NDUFC2 GABARAP TM4SF2 RPL30 RPS17 RPS24 RPS27A MYBPC2 PGK1 GPD1 ACTA1 ENO3 FN1 COL3A1 MYL1 PGM1 GPI LDHA CASQ1 CKM CKMT2 MTATP6 PYGM
|r| > 0.80 BCAR3 SGCA GMPR2 RBBP7 B3GALT4 EEF1D TPT1 DES CSDA MYOZ2 CREG MYL2 FSTL1 RPL21 RPL29 CIDEC PSMB4 FTL RPL4 RPL5 FABP4 ITM2B CAV1 RPL11 RPL17 THRSP OSTF1 EIF3S2 RPL18A NDUFC2 SCD CTSF GABARAP TM4SF2 RPL30 RPL31 RARA PPM1L RPS17 RPS24 ACDC NFE2L1 RPS27A CALB3 AK1 MYBPC2 MYOM2 PGK1 GPD1 ACTA1 ENO3 MYH1 SPARC FN1 COL3A1 MYL1 PGM1 MYL3 GPI LDHA CASQ1 CKM CKMT2 ACTG2 TPM3 FBP2 MTATP6 PYGM ATP1A2
|r| > 0.75 STAC3 GYG NEB NUDT5 ☻ TNNC1 S100A1 ACYP2 BCAR3 SGCA GMPR2 RBBP7 B3GALT4 EEF1D TPT1 DES CSDA MYOZ2 CREG MYL2 FSTL1 RPL21 RPL29 CIDEC ☻ PSMB4 FHL1 FTL RPL4 RPL5 FABP4 ITM2B CAV1 RPL11 RPL17 THRSP OSTF1 EIF3S2 RPL18A RPL19 NDUFC2 SCD CTSF GABARAP TM4SF2 RPL30 RPL31 RARA PPM1L ☻ RPS17 RPS24 ACDC PDLIM3 RYR1 NFE2L1 RPS27A CSRP3 CALB3 ☻ ACTN2 TTN AK1 MYBPC2 MYOM2 ☻ PGK1 GPD1 ACTA1 ENO3 MYH1 SPARC FLJ31121 TT1D ☻ FN1 COL3A1 MYL1 PGM1 MYL3 MYH7 ☻ ☻ UQCRC1 SH3BGR GPI LDHA CASQ1 CKM CKMT2 ACTG2 ☻ ATP2A2 TPM3 ALDH1A1 FBP2 MTATP6 PYGM PHYH NFKB2 ☻ ☻ ATP1A2 TNNT3 TMOD4 NCE2 PET112L
|r| > 0.75 STAC3 GYG NEB NUDT5 ☻ TNNC1 S100A1 ACYP2 BCAR3 SGCA GMPR2 RBBP7 B3GALT4 EEF1D TPT1 DES CSDA MYOZ2 CREG MYL2 FSTL1 RPL21 RPL29 CIDEC ☻ PSMB4 FHL1 FTL RPL4 RPL5 FABP4 ITM2B CAV1 RPL11 RPL17 THRSP OSTF1 EIF3S2 RPL18A RPL19 NDUFC2 SCD CTSF GABARAP TM4SF2 RPL30 RPL31 RARA PPM1L ☻ RPS17 RPS24 ACDC PDLIM3 RYR1 NFE2L1 RPS27A CSRP3 CALB3 ☻ ACTN2 TTN AK1 MYBPC2 MYOM2 ☻ PGK1 GPD1 ACTA1 ENO3 MYH1 SPARC FLJ31121 TT1D ☻ FN1 COL3A1 MYL1 PGM1 MYL3 MYH7 ☻ ☻ UQCRC1 SH3BGR GPI LDHA CASQ1 CKM CKMT2 ACTG2 ☻ ATP2A2 TPM3 ALDH1A1 FBP2 MTATP6 PYGM PHYH NFKB2 ☻ ☻ ATP1A2 TNNT3 TMOD4 NCE2 PET112L
Functional Annotations Step 6 Assess the genomic functionality by significance analysis of the ontologies n = genes on the microarray (n = 624) x = genes in the gene network (x = 102) t = genes in the GO of interest in the entire data z = genes from the GO of interest in the network Armidale Animal Breeding Summer Course, UNE, Feb. 2006
Functional Annotations • Module6 • Cytoskeleton • Transferase activity, glycosyl • Protein biosynthesis • Module 4 • Muscle contraction • Module 1 • Protein biosynthesis • Intracellular • Ribosome • Structural of ribosome • Module 5 • Structural of muscle • Smooth endoplasmic reticulum • Sarcomere • Carbohydrate metabolism • Fatty acid biosynthesis • Energy pathways • Module 3 • Nucleus • Integral to plasma membrane • Protein biosynthesis • Module 2 • Glycolysis •Creatine kinase activity • Muscle development •Tropomyosin binding • Actin binding •Myosin • Striated muscle thick filament •Magnesium ion binding • Transferase activity, phosphorus • Module 7 • Neurogenesis • Protein biosynthesis Armidale Animal Breeding Summer Course, UNE, Feb. 2006
A Quantitative Overview to Gene Expression Profiling in Animal Genetics Functional Annotations for 102 Co-Expressed genes Module 1 Module 2 Module 3 Module 4 Module 5 Module 6 Module 7
A Quantitative Overview to Gene Expression Profiling in Animal Genetics Gene Networks • Conclusions • A gene interaction and regulatory network • has been proposed that: • Goes beyond the standard description of DE genes • Increases our understanding of bovine skeletal muscle growth and development • … or at least, provides for new hypotheses to be postulated • Concerning issues • Limited number of genes and TF (MYOG, MYF6) • Limited number of perturbations (see McWilliam et al. 2005, AAABG Poster) ……………to be addressed in forthcoming work Armidale Animal Breeding Summer Course, UNE, Feb. 2006
A Quantitative Overview to Gene Expression Profiling in Animal Genetics Gene Networks …Growing bigger From 5 to 9 Experiments From 78 to 147 Microarrays From 23 to 47 Conditions Armidale Animal Breeding Summer Course, UNE, Feb. 2006
A Quantitative Overview to Gene Expression Profiling in Animal Genetics Gene Networks …Growing bigger From 5 to 9 Experiments From 78 to 147 Microarrays From 23 to 47 Conditions Nine-Variate Mixed-Model (1,762,338 Eqs, 81 Components): Log2 Intens CGroup Gene (G) (clones) GxArray GxDye GxVariety Error NB: 7,898 Clones representing 822 Genes Armidale Animal Breeding Summer Course, UNE, Feb. 2006
A Quantitative Overview to Gene Expression Profiling in Animal Genetics Gene Networks …Growing bigger Nine-Variate Mixed-Model (1,762,338 Eqs, 81 Components): Armidale Animal Breeding Summer Course, UNE, Feb. 2006
A Quantitative Overview to Gene Expression Profiling in Animal Genetics Gene Networks Identification of Significant Associations • Measure co-expression by a similarity s(i,j) in [0,1] e.g. absolute value of the Pearson correlation coefficient. • Define an adjacency matrix as A(i,j) using an Adjacency Function, AF(s(i,j)) • AF is a monotonic function from [0,1] onto [0,1] • Here we consider 2 classes of AFs: • Threshold: AF(s)=I(s>tau); tau being the threshold that applies across all correlations. • DPI: Data Processing Information Index applied to each trio of genes. Armidale Animal Breeding Summer Course, UNE, Feb. 2006
A Quantitative Overview to Gene Expression Profiling in Animal Genetics Gene Networks Identification of Significant Associations • 2 classes of Adjacency Functions: • Threshold: AF(s) = I(s>tau); tau being the threshold that applies across all correlations. • Cross-Validation: tau > 0.75 FDR < 1% • DPI: Data Processing Information Index applied to each trio of genes in (x, y, z): If s = |rxy| > |rxz|(1) and s = |rxy| > |ryz|(1) then the link between genes x and y is established in the network. Find a criterion for estimating tolerance parameter Armidale Animal Breeding Summer Course, UNE, Feb. 2006
A Quantitative Overview to Gene Expression Profiling in Animal Genetics Gene Networks Identification of Significant Associations If s = |rxy| > |rxz|(1) and s = |rxy| > |ryz|(1) then the link between genes x and y is established in the network. Find a criterion for estimating tolerance parameter Options: A) FIND THAT RESULTS IN APPROXIMATE SCALE-FREE TOPOLOGY (Basso et al. 2005. Nature Gen 37:382). B) FIND THAT RESULTS IN THE HIGHEST MEAN NUMBER OF CONNECTIONS (Partial Correlation Coefficients: de la Fuente et al. 2004. Bioinformatics 20:3565). Criterion A is motivated by the finding that most metabolic networks have been found to exhibit a scale-free topology Criterion B leads to high power for detecting modules (clusters of genes) and hub genes. Armidale Animal Breeding Summer Course, UNE, Feb. 2006
A Quantitative Overview to Gene Expression Profiling in Animal Genetics Gene Networks Identification of Significant Associations My (educated?) Option: A Combination of both The Partial Correlation between x and y given z is the correlation between x and y that is independent of z For every trio of genes in x, y and z (having 92,231,140 combinations of 822 genes taking 3 at a time), we computed the (first-order) partial correlation coefficients in rxy.z, rxz.y and ryz.x. Then, the average ratio of partial to direct (or zeroth-order) correlation was computed as follows: (1) =⅓(rxy.z/rxy + rxz.y/rxz + ryz.x/ryz). This tolerance level equated to 0.689 and the association between genes x and y was set to zero if |rxy| ≤ 0.689 |rxy.z| and |rxy| ≤ 0.689 |rxz.y|. Otherwise, the association was assessed as significant and the connection between the pair of genes established in the reconstruction of the network. Armidale Animal Breeding Summer Course, UNE, Feb. 2006
A Quantitative Overview to Gene Expression Profiling in Animal Genetics Gene Networks Identification of Significant Associations |rxy| > 0.689 |rxy.z| |rxy| > 0.689 |rxz.y|. 42,673 connections out of a possible 337,431 that could have been established from 822 genes. Thus, the C(k) = 12.6%. Armidale Animal Breeding Summer Course, UNE, Feb. 2006
A Quantitative Overview to Gene Expression Profiling in Animal Genetics Gene Networks 123 Genes linked by 312 |r| > 0.75 (FDR < 1%) Armidale Animal Breeding Summer Course, UNE, Feb. 2006
A Quantitative Overview to Gene Expression Profiling in Animal Genetics Gene Networks Validation #1 Hierarchical clustering of correlation coefficients between genes (rows) and transcription factors (TF; columns) reveals modules that comprise clusters affected by biologically meaningful TF. Armidale Animal Breeding Summer Course, UNE, Feb. 2006
A Quantitative Overview to Gene Expression Profiling in Animal Genetics Gene Networks Validation #2 A given gene was allocated to a TF-Hub if the |r| between the gene and this TF was bigger than the |r| between the same gene and any other TF. 796 Genes 26 Transcription Factors Hubs Armidale Animal Breeding Summer Course, UNE, Feb. 2006
A Quantitative Overview to Gene Expression Profiling in Animal Genetics Gene Networks Validation #2 A given gene was allocated to a TF-Hub if the |r| between the gene and this TF was bigger than the |r| between the same gene and any other TF. NB: Entire Network, C(k) = 12.6 % Armidale Animal Breeding Summer Course, UNE, Feb. 2006
A Quantitative Overview to Gene Expression Profiling in Animal Genetics Gene Networks Validation #2 The heat map of the r-matrix (Red = positive r; Blue = negative r) sorted by TF revealed biologically sound structures. Armidale Animal Breeding Summer Course, UNE, Feb. 2006
A Quantitative Overview to Gene Expression Profiling in Animal Genetics Gene Networks Validation #3 Genes involved in myogenic differentiation using ChIP-on-Chip reveal regulatory targets consistent with literature (Blais et al., 2005, Genes & Dev. 19:553). Armidale Animal Breeding Summer Course, UNE, Feb. 2006
A Quantitative Overview to Gene Expression Profiling in Animal Genetics Gene Networks Validation #4 Armidale Animal Breeding Summer Course, UNE, Feb. 2006
A Quantitative Overview to Gene Expression Profiling in Animal Genetics Gene Networks Validation #4 Up-Regulated Genes involved in food depravation have a r structure consistent with their effect (up- or down-regulation). Down-Regulated Armidale Animal Breeding Summer Course, UNE, Feb. 2006