Download
1 / 15
170 likes | 399 Vues
“The Collection, Display, and Summary of Data”. Chapter 2. Chapter 2 Summary By Chris Schulze. Data Description. Chapter 2 - Data Description. In Chapter 2 we discuss describing data by using measures: From the center, The spread, By making visual representations of the data set.

E N D
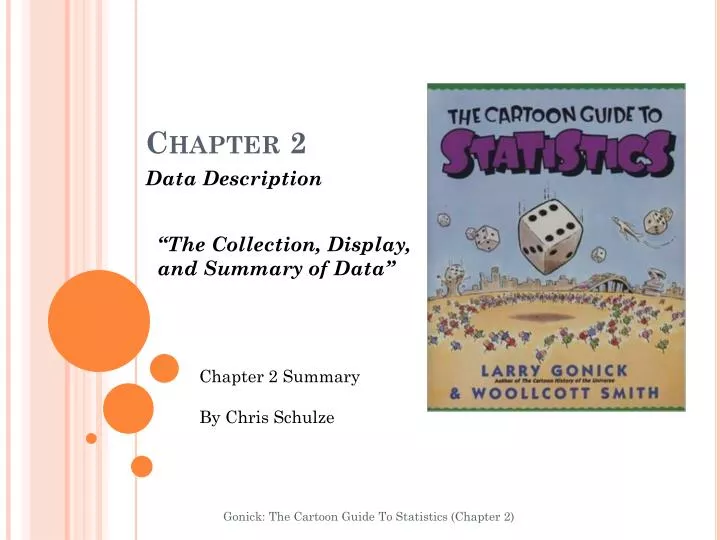
“The Collection, Display, and Summary of Data” Chapter 2 Gonick: The Cartoon Guide To Statistics (Chapter 2) Chapter 2 Summary By Chris Schulze Data Description
Chapter 2 - Data Description • In Chapter 2 we discuss describing data by using measures: • From the center, • The spread, • By making visual representations of the data set. Gonick: The Cartoon Guide To Statistics (Chapter 2)
Methods to Display Data • Dot Plot • Frequency Table • Histogram • Stem-and-Leaf Gonick: The Cartoon Guide To Statistics (Chapter 2)
Frequency Table • A table that lists items and uses tally marks to record and show the number of times they occur. Dot Plot Gonick: The Cartoon Guide To Statistics (Chapter 2) • Is a statistical chart consisting of group of data points plotted on a simple scale. • Used for continuous, quantitative, univariate data. • Suitable for small or moderate sized data sets.
Histogram A graphical display of tabulated frequencies, shown as bars. Shows what proportion of cases fall into each of several categories • Each bar covers an interval • The bar height is the number of data points Gonick: The Cartoon Guide To Statistics (Chapter 2) Relative Frequency Histogram • Plots Relative Frequency against the Weight • Same as the Histogram • Except for the vertical scale
Stem-and-Leaf Used to analyze large amounts of numbers. • Two columns • Data is arranged by place value • Stem – The digits in the largest place • Leaf – The digits in the smallest place • Shows trends or Bias • Easy to use • Compact arrangement Gonick: The Cartoon Guide To Statistics (Chapter 2)
Measures of the Center Values at the middle or center of a data set. • The Mean • The average value of your data set • Obtained by adding all the data and dividing by the number of observations • The Median • Not sensitive to extreme values • It is the middle value of you data set Gonick: The Cartoon Guide To Statistics (Chapter 2) Mean = 42/13 = 3.23 Median = 4
Measures of Spread Tells us how much a data sample is spread out or scattered • Histogram • Box and Whiskers • InterQuartile Range (IQR) • Outliers • Standard Deviation • Variance Gonick: The Cartoon Guide To Statistics (Chapter 2)
Box and Whiskers (Box Plot) • InterQuartile Range (IQR) • The middle 50 • It is equal to the difference between the 3rd and 1st quartiles. • Outliers • an observation that is numerically distant from the rest of the data. Gonick: The Cartoon Guide To Statistics (Chapter 2)
Standard Deviation • Helps to measure how “spread out” a distribution is. • Standard Deviation (S) = The average distance from the Mean (using squares). • It is also the square root of the variance. Where: X = list of numbers N = How many number are in the list ∑ = Sum of the numbers x = Mean S = Standard Deviation Gonick: The Cartoon Guide To Statistics (Chapter 2)
Z – Scores • Z-Score (or standard score) indicates how many standard deviations an observation or datum is above or below the mean. • Z – Score = The distance from the mean per standard deviation. Gonick: The Cartoon Guide To Statistics (Chapter 2) Where: X = Raw Score to be standardized x = Mean S = Standard Deviation
Empirical Rule (68-95-99.7) If data distribution is approximately normal then 68% of the values are within 1 standard deviation of the mean, 95% of the values are within two standard deviations, and 99.7% are within 3 standard deviations. • Specifically applies to a normal bell-shaped distribution • Frequently applied to any mounded distribution Gonick: The Cartoon Guide To Statistics (Chapter 2)
Key Terms to Remember • Frequency • Histogram • Stem-and-leaf diagram • Mean • Median • Interquartile Range (IQR) • Box plot • Box and whiskers plot • Variance • Standard deviation • Z-score • Outlier Gonick: The Cartoon Guide To Statistics (Chapter 2)
Helpful Websites http://www.dimensionresearch.com/index.html http://stattrek.com http://easycalculation.com/statistics http://www.tutorvista.com
References • http://jalt.org/test/str_2.htm, Shiken: JALT Testing & Evaluation SIG Newsletter • http://www.wikipedia.org/ • http://www.khanacademy.org/ • The Cartoon Guide to Statistics, Gonick, 1993 • An Introduction to Statistical Problem Solving in Geography, McGrew, 1993 Gonick: The Cartoon Guide To Statistics (Chapter 2)