Download
1 / 1
10 likes | 156 Vues
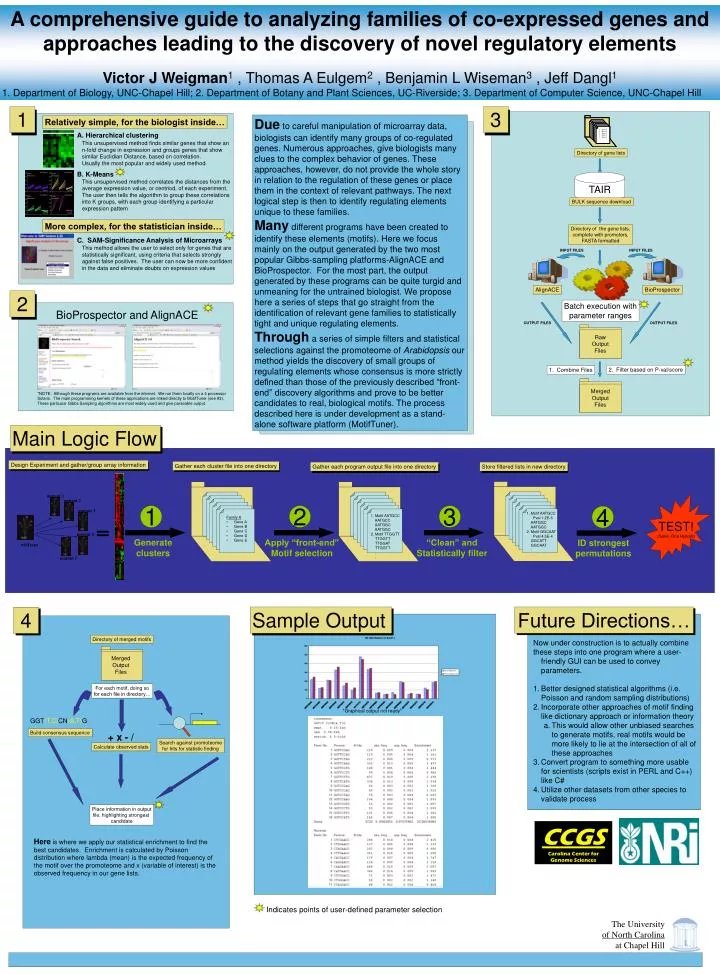
mutant 1. mutant 2. mutant 3. mutant 4. wild type. mutant 5. A comprehensive guide to analyzing families of co-expressed genes and approaches leading to the discovery of novel regulatory elements Victor J Weigman 1 , Thomas A Eulgem 2 , Benjamin L Wiseman 3 , Jeff Dangl 1

E N D
mutant 1 mutant 2 mutant 3 mutant 4 wild type mutant 5 A comprehensive guide to analyzing families of co-expressed genes and approaches leading to the discovery of novel regulatory elements Victor J Weigman1 , Thomas A Eulgem2 , Benjamin L Wiseman3 , Jeff Dangl1 1. Department of Biology, UNC-Chapel Hill; 2. Department of Botany and Plant Sciences, UC-Riverside; 3. Department of Computer Science, UNC-Chapel Hill 1 3 Due to careful manipulation of microarray data, biologists can identify many groups of co-regulated genes. Numerous approaches, give biologists many clues to the complex behavior of genes. These approaches, however, do not provide the whole story in relation to the regulation of these genes or place them in the context of relevant pathways. The next logical step is then to identify regulating elements unique to these families. Many different programs have been created to identify these elements (motifs). Here we focus mainly on the output generated by the two most popular Gibbs-sampling platforms-AlignACE and BioProspector. For the most part, the output generated by these programs can be quite turgid and unmeaning for the untrained biologist. We propose here a series of steps that go straight from the identification of relevant gene families to statistically tight and unique regulating elements. Through a series of simple filters and statistical selections against the promoteome of Arabidopsis our method yields the discovery of small groups of regulating elements whose consensus is more strictly defined than those of the previously described “front-end” discovery algorithms and prove to be better candidates to real, biological motifs. The process described here is under development as a stand-alone software platform (MotifTuner). Relatively simple, for the biologist inside… A. Hierarchical clustering This unsupervised method finds similar genes that show an n-fold change in expression and groups genes that show similar Euclidian Distance, based on correlation. Usually the most popular and widely used method. Directory of gene lists B. K-Means TAIR This unsupervised method correlates the distances from the average expression value, or centriod, of each experiment. The user then tells the algorithm to group these correlations into K groups, with each group identifying a particular expression pattern BULK sequence download More complex, for the statistician inside… Directory of the gene lists, complete with promoters, FASTA formatted C. SAM-Significance Analysis of Microarrays This method allows the user to select only for genes that are statistically significant, using criteria that selects strongly against false positives. The user can now be more confident in the data and eliminate doubts on expression values INPUT FILES INPUT FILES AlignACE BioProspector 2 Batch execution with parameter ranges BioProspector and AlignACE OUTPUT FILES OUTPUT FILES Raw Output Files 2. Filter based on P-val/score 1. Combine Files Merged Output Files *NOTE: Although these programs are available from the internet. We run them locally on a 4 processor Solaris. The main programming kernels of these applications are linked directly to MotifTuner (see #3). These particular Gibbs Sampling algorithms are most widely used and give parseable output. Main Logic Flow Design Experiment and gather/group array information Gather each cluster file into one directory Gather each program output file into one directory Store filtered lists in new directory TEST! (Selex, One Hybrids) 1 2 3 4 1. Motif AATGCC Pval 1.2E-6 AATGGC AATGGC 2. Motif GGCAAT Pval 4.5E-4 GGCATT GGCAAT . . 1. Motif AATGCC AATGCC AATGGC AATGGC 2. Motif TTGGTT TTGGTT TTGGAT TTGGTT . . • Family A • Gene A • Gene B • Gene C • Gene D • Gene E Generate clusters Apply “front-end” Motif selection “Clean” and Statistically filter ID strongest permutations Sample Output Future Directions… 4 Directory of merged motifs • Now under construction is to actually combine • these steps into one program where a user-friendly GUI can be used to convey parameters. • Better designed statistical algorithms (i.e. Poisson and random sampling distributions) • Incorporate other approaches of motif finding like dictionary approach or information theory • This would allow other unbiased searches to generate motifs, real motifs would be more likely to lie at the intersection of all of these approaches • Convert program to something more usable for scientists (scripts exist in PERL and C++) like C# • Utilize other datasets from other species to validate process Merged Output Files For each motif, doing so for each file in directory… *Graphical output not ready* GGT(T,C)CN(A,T)G Build consensus sequence + x - / Search against promoteome for hits for statistic finding Calculate observed stats Place information in output file, highlighting strongest candidate CCGS Carolina Center for Genome Sciences Here is where we apply our statistical enrichment to find the best candidates. Enrichment is calculated by Poisson distribution where lambda (mean) is the expected frequency of the motif over the promoteome and x (variable of interest) is the observed frequency in our gene lists. Indicates points of user-defined parameter selection The University of North Carolina at Chapel Hill