Download
1 / 56
570 likes | 581 Vues
Simulation of the Bohai Sea Circulation and Thermohaline Structure Using a Coupled Hydrodynamical-Ecological Model. by LCDR Rodrigo Obino Brazilian Navy. Thesis Presentation – Naval Postgraduate School. Outline. Objectives Background Model Features Experiments Case Analysis

E N D
Simulation of the Bohai Sea Circulation and Thermohaline Structure Using a Coupled Hydrodynamical-Ecological Model by LCDR Rodrigo Obino Brazilian Navy Thesis Presentation – Naval Postgraduate School
Outline • Objectives • Background • Model Features • Experiments • Case Analysis • Turbulence Study • Conclusions • Recommendations
Objectives • Simulation of the Bohai Sea using COHERENS model • Sensitivity studies with different forcing functions • Physical mechanisms for the Bohai Sea circulation and thermohaline structure • Comparison between two turbulence schemes
Background • Eastern China • Mid latitude • Semi-Enclosed sea • Connected to the Yellow Sea Bohai Sea Korean Peninsula Yellow Sea China East China Sea
The Bohai Sea Liaohe R Liaodong Gulf Liaodong Peninsula Huanhe R. Haihe R. Central Basin Bohai Gulf Yellow Sea Bohai Strait Huanghe River Laizhou Bay
Characteristics • Surrounded by the Chinese mainland and Liaodong Peninsula • Connected to the northern Huanghai Sea (Yellow Sea) through the Bohai Strait • Divided in four parts: Liaodong Gulf, Bohai Gulf, Laizhou Bay and Central Basin • Area of 80,000 km square, width of 300 km and length of 500 km • Relatively shallow waters
Topography • Average depth – 18 m • Maximum depth at Bohai Strait – 60 m • Open boundary relatively deep • Gulfs are shallow
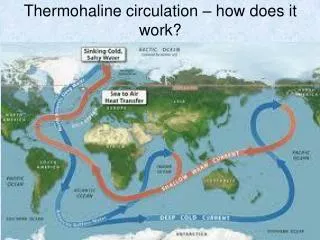
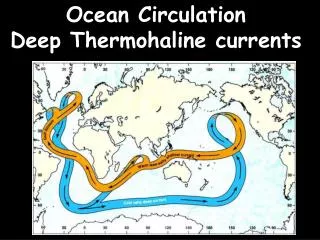
Circulation • Driven by strong monsoon winds, large buoyancy forces, active tidal mixing, strong open ocean forcing • Winter current – surface mainly wind- driven transport • Anticyclonic pattern in central basin winter monsoon
Circulation • Weaker in summer than in winter due to weaker winds • Counterclockwise gyre in central-northern part of Bohai Sea summer monsoon
Monsoon • Siberian High • Relatively strong, cold and dry NW-NE winds winter monsoon Nov - Mar • Low over East Asia • Relatively weak, warm and moist SE-SW winds summer monsoon Jun - Sep
Model Features • COHERENS – Coupled Hydrodynamical- Ecological Model for Regional and Shelf Seas • 3-D hydrodynamical model coupled to sediment, contaminant, and biological models • Flexibility • Developer: EU Marine Science and Technology (MAST)
Hydrohynamical Equations • Governing Primitive Equations derived from Navior-Stokes Equations • Boussinesq approximation, hydrostatic equilibrium and incompressibility • Mode-splitting technique – coupling between external and internal modes • Sea surface elevation and depth-integrated velocities – external mode • Three dimensional currents, temperature and salinity – internal mode
Discretization • Formulation in spherical coordinates (λ,φ,z) • Vertical terrain-following coordinate – σ • Sigma coordinate – 0 at the bottom and 1 at the surface – 16 levels , -h z • Horizontal differencing – Arakawa staggered C-scheme – 2nd order centered • Horizontal grid – 62x50 points - 9 km
Other Features • Coastline and bottom topography – DBDB5 5’ resolution • External time step – 15 sec Internal time step – 10 min • Free surface BC and slip bottom BC Zero gradient open BC • Spinup – Jul 01 1999 to Jan 01 2000 - 0000Z • Simulations – Jan 01 2000 to Dec 31 2000
Initialization • Initial conditions for Spinup – GDEM climatological data, and zero velocities and sea surface elevation • Initial conditions for simulations – last information obtained in the spinup for all scalar and vector parameters
Forcings • Tidal harmonics at open boundary phase and amplitude: M2, S2, N2, K2, K1, O1, P1 and Sa • Climatological data at open boundary monthly GDEM temperature and salinity • Atmospheric forcing over the sea surface (Full flux forcing) • No river runoff
Atmospheric Forcing Function • National Center for Environmental Prediction (NCEP) Reanalysis Data – 2.5° global grid (4 times daily) and interpolated to model grid • Parameters: wind components at 10 m, air temperature, sea surface pressure, relative humidity, precipitation rate and cloudiness • Interpolated on each time step
Air Temperature at Sea Surface 15 January 2000 15 July 2000
Wind Field at 10 m 15 January 2000 15 July 2000
Sea Surface Pressure 15 January 2000 15 July 2000
Relative Humidity 15 January 2000 15 July 2000
Cloudiness 15 January 2000 15 July 2000
Precipitation Rate 15 January 2000 0 15 July 2000
Experiments • Control Run – all forcing functions • Non-Fluxes Run – exclude heat and salt fluxes • Non-Tidal Run – tide effect not considered • Non-Wind Run – no surface stress due to winds Adopted same settings for all runs – types of turbulence scheme, advection and diffusion
Control Run • Most complete case • Analysis based on T, S and V fields • Plots only January and July Zonal and Meridional Vertical Cross-Sections
Horizontal Temperature and Velocity Vectors January 2000 • Head of Gulfs are colder • Northern Bohai Strait warmer • Velocities are S-SE and strong • Inflow at open boundary and outflow at the southern part July 2000 • Head of Gulfs are warmer • N Bohai Strait relatively cold • Open boundary is colder • Currents flow NE • Still strong current at N Bohai Strait surface
January 2000 • Confirms warmer N Bohai Strait • Relatively low temperature at central basin • Currents weaker than at surf July 2000 • Warm region at central basin • Penetration of sub-surface cold water mass from YS • Currents weaker than at surf • Anticyclonic gyre at central basin mid-depth
January 2000 • Temperature almost the same as the SST field • Currents are more N-NE, but weaker July 2000 • Temperature different from the SST field • Presence of cold water mass from YS – North YS Bottom Cold Water bottom
Vertical Temperature Cross-Sections January 2000 • Vertically uniform • Shallow regions are colder July 2000 • Some stratification • North YS Bottom Cold Water • Surface and shallow regions are warmer Along meridian121º01’E
January 2000 • No stratification July 2000 • Some stratification Alongparallel 38º35.5’N
Horizontal Salinity Field 15 January 2000 • Fresher region near Huanghe River delta • Saltier at central basin 15 July 2000 • Saltier at Bohai Gulf head • Values have increased slowly along the year • No river runoff surface
Vertical Salinity Cross-Sections 15 January 2000 • Vertically uniform 15 July 2000 • Little stratification Along meridian 121º01’E
15 January 2000 • Vertically uniform 15 July 2000 • Little stratification Along parallel 38º35.5’N
Effects of Surface Thermohaline Forcing (Control – No Fluxes) • Winter (January): cooling, reduction of the circulation, minor effect on salinity. The effects are vertically uniform. • Summer (July): warming, saline, enhancement of the circulation. The effects decrease with depth except in the shallow water regions. There is no effect on temperature in the deeper layer connecting to the Yellow Sea.
Temperature and Velocity Differences January 2000 January 2000 July 2000 July 2000 surface bottom
In winter vertically uniform, while in summer some stratification January 2000 January 2000 July 2000 July 2000
Salinity Differences 15 January 2000 • Differences increase along the year • Head of Gulfs present highest differences • Bohai Strait and eastern boundary have smaller differences 15 July 2000 surface
Surface layer more affected by salt fluxes and even more in July 15 January 2000 15 January 2000 15 July 2000 15 July 2000
Wind Effect (Control – No Wind) • Winter (January): cooling in deeper region, warming at southern Bohai Strait, enhancement of the circulation, presence of salty and fresher spots in the central basin. The effects are vertically uniform. • Summer (July): warming in central basin and in shallow regions, cooling in deeper region, enhancement of the circulation, fresher at surface layer. There is some variability in the surface layer.
Temperature and Velocity Differences January 2000 January 2000 July 2000 July 2000 surface
Salinity Differences 15 January 2000 15 January 2000 15 July 2000 15 July 2000 surface
Tidal Mixing (Control - No Tides) • Winter (January): reduction of the circulation in the central basin, variable effect on temperature. The effects are vertically uniform. • Summer (July): warming close to the bottom and cooling in surface layer, enhancement of the circulation in the central basin. There is no effect on temperature in the deeper layer connecting to the Yellow Sea.
Temperature and Velocity Differences January 2000 January 2000 July 2000 July 2000 surface
Salinity Differences 15 January 2000 15 January 2000 15 July 2000 15 July 2000 surface
Turbulence Study • Vertical eddy viscosity and diffusion coefficients parameterized by turbulence scheme • Study = “k-l” x “k-” • Spatial and Seasonal comparisons • Observed parameter – TKE • Selected 6 points • January and July
Spatial and Seasonal Comparison January – Sta # 2 July – Sta # 3 “k-l” (green) > “k-” (blue)
Diurnal and Seasonal Variation “k-” Turbulence Closure Scheme Sta # 4 15 January 2000 Sta # 5 15 January 2000 15 July 2000 15 July 2000 • Summer reaches higher values • Summer has weak turbulence in deeper layer