Download
1 / 15
150 likes | 257 Vues
The Polling Process. Measuring Public Opinion. Define the Universe. Who does the poll represent? Who is it measuring?. Random Sample. US Adult Population = 250 Million … Sample Size = 1500 . Quota Sample. Construct a Sample. Who will ACTUALLY be polled? Who will represent the Universe?.

E N D
The Polling Process Measuring Public Opinion
Define the Universe Who does the poll represent? Who is it measuring?
Random Sample US Adult Population = 250 Million … Sample Size = 1500 Quota Sample Construct a Sample Who will ACTUALLY be polled? Who will represent the Universe? ?
Prepare Valid Questions What makes a question valid? Do you feel that gay marriage should be allowed? Vague: What do you think about Obama? Emotionally Charged: Do you think Immigrants have the right to come to America and take American jobs? Do you feel that our immigration laws need reform? Leading: Do you feel that guns are responsible for the recent wave of mass shootings? Do you feel that America is in need of stricter gun control legislation? Biased: Do you think that the 14th amendment protections against discrimination protect gay marriage since it says all people should have equal rights? How well do you think that Obama has handled the crisis in Syria?
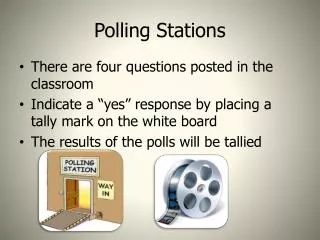
Interview How the Questions are delivered makes a big difference
Analyze and Report Findings What does data tell you? Make predictions and connections SEE THE BIG PICTURE Gallup Tracking Polls
Polling Project!!! Get into your groups (if you aren’t already)
Before you begin the process… • Choose a SCHOOL issue • 1st come, 1st served • Could already exist, or be brand new • Be sure to choose something that could have varied opinions
Define the Universe • Easy…Done: • UNIVERSE = All Students at Glendale High School • Using the Internet (or another reliable source), find out GHS’s Student Population • Search for “SARC” (School Accountability Report Card)
Construct a Sample - Random • Random Sample: • You won’t be doing this one. • HOWEVER, create a quick plan to implement a random sample if you were going to • How would you do it? • How would you be sure it’s random?
Construct a Sample - Quota • Quota Sample • Compile GHS’s Demographics • Grade Level, Gender (assume a 50/50 gender split), Race • Create a Quota Sample that is made up of 1% of the Total Student Population – (pop x .01… round to nearest whole number) • Using the population, determine how many students from each group (grade level, gender, race) will need to be included • Keep the % the same … round to nearest whole number • If a group < 1%, do not include • Ridiculously…Armenians count as “white”, so they should in your poll too • Remember, people will fit more than 1 category, so account for this • Tip – break down Race % 1st, then determine how many total you need from each class, then determine how many need to be male/female
Prepare Valid Questions • Come up with 10 VALID questions to ask them • Questions should be quantifiable • Avoid open-ended questions • Limit response options to no more than 5
Interview • PUT YOUR POLL IN THE FIELD!!! • Decide how you want to interview • Divide up b/w group members • Ask, Answer, Record vs. Print out questionnaire • Label EACH interview with the race, gender, and grade level • I don’t need the student’s name – HONOR SYSTEM!!! • No interviewing anyone from this class!!!
Analyze and Report Findings • Compile Data • Create Powerpoint with your results • Walk us through your whole process • Things to include: • Graphs and % for key questions • Conclusions you can draw • “Big Picture” analysis of data and findings • Accuracy flaws that you noticed throughout the project • Create Report • Full Description of Findings/Data/Conclusions • Include data and graphs from each question • Include demographic breakdown for each question