Download
1 / 29
290 likes | 459 Vues
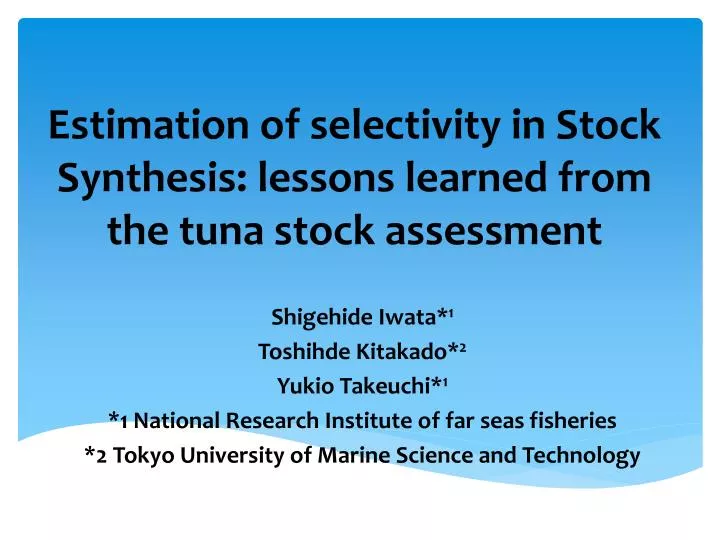
Estimation of selectivity in Stock Synthesis : lessons learned from the tuna stock assessment. Shigehide Iwata* 1 Toshihde Kitakado * 2 Yukio Takeuchi* 1 *1 National Research Institute of far seas fisheries *2 Tokyo University of Marine Science and Technology. Background (1).

E N D
Estimation of selectivity in Stock Synthesis: lessons learned from the tuna stock assessment Shigehide Iwata*1 ToshihdeKitakado*2 Yukio Takeuchi*1 *1 National Research Institute of far seas fisheries *2 Tokyo University of Marine Science and Technology
Background (1) Estimation of size selectivity has a large impact on results of stock assessment However, size composition data are sometimes complex (e.g. bimodal, trimodal…) As a result, the estimation of size selectivity has difficultyThat was the case in the Pacific Bluefin Tuna assessment
Background (2) In the case of Pacific Bluefin Tuna (PBFT) assessment, estimation of size selectivity was one of key issuesbecause of some difficulty with many fleets to be considered and complicated size distribution data By these difficulty, we were not able to get reasonable estimates of selectivity parameters in a normal estimation procedure (i.e. estimation using parametric functional forms, estimation of all the parameters once)
Background (3)For the size composition data in PBFT assessment Circle size indicate the amount of sample size Fleet4(Tuna Purse Seine) There are bimodal distributions in the observation data at several year
Purpose of this talk . We will introduce some LESSONS learned from the Pacific Bluefin Tuna assessment with focusing on 1. Functional form (non-parametric or parametric) 2. An iterative estimation procedure (an extension of a method used in the IATTC yellow fin stock assessment)
Definitions of parameters • : Selectivity parameters (nuisance parameters) • : Other parameters, include parameters of primary interests • : Number of parameters
Method (1)Functional form Non-parametric selectivity functional forms are strong tools for estimation of selectivity curve (It is expected to achieve more flexible fit) Wehope to have a betterfit to size composition data by using non-parametric functional form with same or least number of parameters.
Method (2)Cubic Spline Number of parameter is AT LEAST4. We hope the following situation in total likelihood L(θ,φ): Holds, if whereindicates parameter for fleet x by using Non-parametric functional form (resp. parametric functional form) As non-parametric functional form, cubic spline implemented in the Stock Synthesis 3
Runs explanation Parametric.sso:Fleet4:Double normal function 4 parameters node3.sso, node5.sso and node9.sso :Fleet4:Cubic Spline (non-parametric) 1+x parameters (x=3,5 and 9)
Survey 1 Results (1)CPUE fit There is no significant change to the CPUE fit by increasing of # of nodes. Survey 2 Survey 5 Survey 9 Survey 3 the confidence interval the observed CPUE
Results (2)fit to size compositiondata Fleet1 Fleet2 Fleet3 ・・・Observed data Fleet4 Fleet5 Fleet6 The fit to the size composition data except for fleet 4 does not change by using cubic spline. So the size compositions except for fleet4 are expected to give the big impact on θ Fleet7 Fleet8 Fleet9 Fleet10 Fleet11 Fleet12 Fleet13 Fleet14
Results (3)fit to the size composition data -By using cubic spline curves, the fit to size composition would be improved -However, there was no significant changein the fit tosize composition data by increasing of # of nodes ・・・Observed data Fit to the size composition data Estimated selectivity curve
Results (4)The dynamics of SSB and Recruitment SSB Recruitment There is no significant change in the dynamics of SSB and Recruitment
Results (5)likelihood change Total Negative Log Likelihood To be better In the case of sable fish stock assessment (example in yesterday’s talk), the node numbers are 4 or 5
Summary of non-parametric functional form By using the non-parametric selectivity functional form -Total likelihood do not improve even if # of nodes are 3 or 5. -Total likelihood will be improved If the # of nodes are 9. However the SSB and Recruitment dynamics did not significantly change. In the case of sable fish stock assessment (example in yesterday’s talk), the number of nodes is 4 or 5. So 9 nodes are too much.
Definitions of parameters (again) • : Selectivity parameters (nuisance parameters) • : Other parameters, include parameters of primary interests • : Number of parameters
Method (1) General formation “Joint likelihood” “Partial likelihood” contributed by CPUEs “Residual likelihood” contributed by size comps
Method (2)Procedures • A two-step method was employed in the Yellow fin stock assessmentin 2012 • HOWEVER, the initially fixed selectivity parameters may not necessarily be the possible best option because those parameters j may be revised by maximizing the residual likelihood (L2) given better estimates of q • If the further treatment above would produce the better j, thenq should be updated again
An iteratively-fixing method using two separated-likelihood functions Set initial parameter values (arbitrary) This time, we used estimates based on the joint likelihood as in YFT tuna stock assessment way, Then, continue iterative processes as follows
The points to accept this method or not are… Next, we shows the results after 40 iterative (80 runs, 1 iterative have odd and even run). The results tend to CONVERGE (especially estimated SSB, recruitment and selectivity) within the odd or even times To get better parameters
Results (1)Fleet 1 Before iterative run After 40 iterative run the confidence interval the observed CPUE
Results (2)Fleet 11 Before iterative run After 40 iterative run the confidence interval the observed CPUE
Results (3)CPUE fit all Survey 2 Survey 5 Survey 1 Survey 9 Survey 3 Before iterative run After 40 iterative run the confidence interval the observed CPUE
Results (4)size selectivity fit Fleet1 Fleet2 Fleet3 Before iterative run After 40 iterative run Fleet4 Fleet5 Fleet6 Fleet7 Fleet8 Fleet9 In the almost fishery, we can get better size selectivity curve. Fleet10 Fleet11 Fleet12 Fleet13 Fleet14
Results (6)Convergence For the odd iteration run for SPB For the odd iteration run for Recruitment / / Increasing of iteration Increasing of iteration Each line indicates the SSB or REC ratio at same year during stock assessment period By the Raabe's convergence test, we can conclude the SSB and Recruitment will be converge
Results (7)SSB and recruitment After the iterations, series of SSB and recruitment are converged. However the levels of SSB are different between two runs Hope this change is “improvement”, but it is necessary to conduct a comprehensive simulation study for more valid conclusion Before iterative run After 40 iterative run
Summary • There was no impact on SSB and Recruitment by increase the number of nodes in PBFT • The total likelihood dramatically changed only if number of nodes is 9. So, there is no improvement by the introduction of non-parametric functional forms and these were not suitable for the PBF stock assessment. • The iterative method aimed at providing better estimation of population dynamics. Although the method is not perfect in terms of fitting, but some improvement was observed in the CPUE and size composition(good sign ??) • Need more practice and investigation on this method