Download
1 / 38
390 likes | 410 Vues
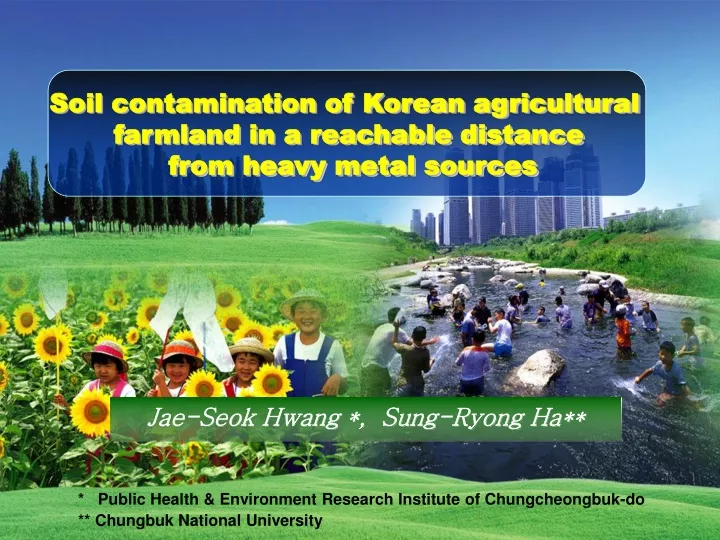
Soil contamination of Korean agricultural farmland in a reachable distance from heavy metal sources. Jae-Seok Hwang *, Sung-Ryong Ha**. * Public Health & Environment Research Institute of Chungcheongbuk-do ** Chungbuk National University.

E N D
Soil contamination of Korean agricultural farmland in a reachable distance from heavy metal sources Jae-Seok Hwang *, Sung-Ryong Ha** * Public Health & Environment Research Institute of Chungcheongbuk-do ** Chungbuk National University
○ Recently, Mass production and consumption caused by increasing industrialization have been expended to the Environmental problem such as soil contamination in Korea. ○ Especially, chemical fertilizer and agrichemicals scattering on cultivated land had been decreasing traditional compost. So, production capacity of soil has decreased in now. Study Background I
Study Background I ○ Heavy metal included in auto exhausts, industrial waste water and waste matter is discharged in the air or water stream. And then, after repetitive process between runoff in rainy season and strengthening in dry season Heavy metal is accumulated in soil. It makes heavy metal content increase largely in soil. ○ Also, leakage of oil and toxic substances storage facilities placed in town and drained waste water from a mine have been contaminating surrounded agricultural area.
Study Objective and Scope II ○ Objective Therefore, this study aims to investigate the actual condition of agricultural farmland placed in a reachable distance from heavy metal sources. ○ Scope - Investigated heavy metals were 5. such as Cd, Cu, Pb, As and Hg. - Pollution source was classified into Industrial A, Industrial B, Industrial C, Mine, Wastes and Others. - Agricultural farmland area was classified into paddy field, upland cultivation, forest, residential area, orchard, factory land, others.
Materials and Method III A. Location of survey area and numbers of sampling site. Figure 1. Location of the Sampling Site
Materials and Method III The annual average temperature is 12.7℃; the monthly average temperature of the hottest month, July, reaches 26℃; and that of the coldest month, January is -1.7℃. The annual range is 27.7℃ and the annual rainfall 1,505.9㎜. B. Climate characteristics of the survey area
Materials and Method III By heavy metal generating sources By land use types Allocating sampling sites on the study map C. Selection of sampling sites with taking into account two indices ; Land use types and Heavy metal sources.
Materials and Method III D. Sampling site classification by land use types
Materials and Method III E. Sampling site classification by heavy metal sources types
Materials and Method III F. Spatial sampling schemes < For agricultural area> < For urbanized area > Figure 2. Methods for soil sampling
Materials and Method III G. Soil sampler and sampling procedures Figure 4. Procedure Figure 3. Hand soil sampler
Materials and Method III H. Analytical methods of heavy metals
Materials and Method III 1 Descriptive statistics - Average weighted : - Standard deviation : 2. Non-excessible probability distribution by plotting position Rank formula P(xi ≤ x*) = ( 1 ----------- ) x 100 n+1 n = number of samples Rank = recording order 3. Correlation analysis between heavy metals using Correlation coefficient I. Statistical analysis scheme
Results and discussion IV A. Hydrogen ion concentration(pH) 1. Non-excessible probability distribution of pH Figure 5. Non-excessible probability distribution of pH
Results and discussion IV 2. pH by land use Figure 6. pH by land use
Results and discussion IV 3. pH by heavy metal source Figure 7. pH by heavy metal sources.
Results and discussion IV Okcheon Geopung mine (1.807 mg/kg) Land use : Paddy field Heavy metal source : Mine B. Cadmium(Cd) 1. Non-excessible probability distribution of Cd Korean EPA Standard Concentration World Average Concentration of Earth Crust 0.2mg/kg 1.5mg/kg Figure 8. Non-excessible probability distribution of Cd
Results and discussion IV 2. Cd by land use Korean EPA Standard Concentration World Average Concentration of Earth Crust 1.5mg/kg Okcheon Geopung mine (1.807 mg/kg) 3.995mg/kg Figure 9. Cadmium concentration by land use
Results and discussion IV 3. Cd by heavy metal source Korean EPA Standard Concentration World Average Concentration of Earth Crust 1.5mg/kg Okcheon Geopung mine (1.807 mg/kg) 3.995mg/kg Figure 10. Cadmium concentration by Heavy metal sources.
Results and discussion IV Goesan Pungsan mine (107.082 mg/kg) Land use : Paddy field Heavy metal source : Mine C. Copper(Cu) 1. Non-excessible probability distribution of Cu Korean EPA Standard Concentration World Average Concentration of Earth Crust 3.995mg/kg 50mg/kg Figure 11. Non-excessible probability distribution of Cu
Results and discussion IV Goesan Pungsan mine(107.082 mg/kg) 2. Cu by land use Korean EPA Standard Concentration World Average Concentration of Earth Crust 50mg/kg 3.995mg/kg Figure 12. Copper concentration by land use
Results and discussion IV Korean EPA Standard Concentration World Average Concentration of Earth Crust Goesan Pungsan mine (107.082 mg/kg) 3. Cu by heavy metal source 1.5mg/kg 3.995mg/kg Figure 13. Copper concentration by Heavy metal sources.
Results and discussion IV D. Arsenic(As) 1. Non-excessible probability distribution of As Korean EPA Standard Concentration World Average Concentration of Earth Crust 6.0mg/kg 0.560mg/kg Figure 14. Non-excessible probability distribution of As
Results and discussion IV 2. As by land use 6.0mg/kg Korean EPA Standard Concentration World Average Concentration of Earth Crust 0.560mg/kg Figure 15. Arsenic concentration by land use
Results and discussion IV 3. As by heavy metal source 6.0mg/kg Korean EPA Standard Concentration World Average Concentration of Earth Crust 0.560mg/kg Figure 16. Arsenic concentration by Heavy metal sources.
Results and discussion IV E. Mercury(Hg) 1. Non-excessible probability distribution of Hg Korean EPA Standard Concentration World Average Concentration of Earth Crust 0.085mg/kg 4.0mg/kg Figure 17. Non-excessible probability distribution of Hg
Results and discussion IV 2. Hg by land use 4.0mg/kg Korean EPA Standard Concentration World Average Concentration of Earth Crust 0.085mg/kg Figure 18. Mercury concentration by land use
Results and discussion IV 3. Hg by heavy metal source 4.0mg/kg Korean EPA Standard Concentration World Average Concentration of Earth Crust 0.085mg/kg Figure 19. Mercury concentration by Heavy metal sources.
Results and discussion IV Youngdong samdong mine (109.864mg/kg) Land use : Paddy field Heavy metal source : Mine Korean EPA Standard Concentration World Average Concentration of Earth Crust F. Lead(Pb) 1. Non-excessible probability distribution of Pb 5.375mg/kg 100mg/kg Figure 20. Non-excessible probability distribution of Pb
Results and discussion IV Youngdong samdong mine (109.864mg/kg) 2. Pb by land use 100mg/kg Korean EPA Standard Concentration World Average Concentration of Earth Crust 5.375mg/kg Figure 21. Lead concentration by land use
Results and discussion IV Youngdong samdong mine (109.864mg/kg) 3. Pb by heavy metal source Korean EPA Standard Concentration World Average Concentration of Earth Crust 100mg/kg 5.375mg/kg Figure 22. Lead concentration by Heavy metal sources.
Results and discussion IV G. Zinc(Zn) 1. Non-excessible probability distribution of Zn (215.343mg/kg) Korean EPA Standard Concentration World Average Concentration of Earth Crust 70mg/kg 300mg/kg Figure 23. Non-excessible probability distribution of Zn
Results and discussion IV Korean EPA Standard Concentration 2. Zn by land use World Average Concentration of Earth Crust 300mg/kg 70mg/kg Figure 24. Zinc concentration by land use
Results and discussion IV 3. Zn by heavy metal source 300mg/kg Korean EPA Standard Concentration World Average Concentration of Earth Crust 70mg/kg Figure 25. Zinc concentration by Heavy metal sources.
Results and discussion IV H. Correlation amongHeavy metals Table 5. Rank correlation coefficients for metals in the soil (n=154) of the Chungcheongbuk-do
Results and discussion IV ○ Abandoned metal mines were estimated about 900 in Korea, and it had been reported that 150 abandoned mines located in Chungcheongbuk-do. Those abandoned mines have affected to various environmental pollution due to lots of produced debris. ○ The areas near the metal mines were 31 areas among 154 sampling site area. It means those area was occupied about 20% of the whole survey area ○ Among 31 metal mines, 3 areas were exceeded Korean EPA Standard concentration of soil contamination. It’s about 10% of them. I. Pollution of Heavy Metals in Abandoned Mines
Conclusion V 1. As a result of surveying distributed characteristics of harmful substances, such as heavy metals, the orchard had the highest concentration of copper, arsenic, lead, and zinc than any other land use types. 2. This investigation results showed that heavy metal concentrations (Cd 1.807mg/kg,Cu 107.802mg/kg, Pb 109.864mg/kg ) exceeded the reference value of the Korean EPA Standard Concentration in the paddy field of the Geopung mine, Pungsan mine and samdong mine site.