Download
1 / 19
190 likes | 200 Vues
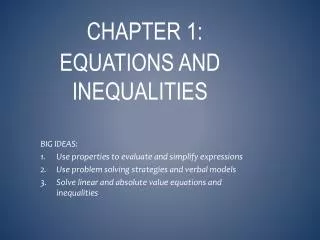
Chapter 1: Linear Functions, Equations, and Inequalities. 1.1 Real Numbers and the Rectangular Coordinate System 1.2 Introduction to Relations and Functions 1.3 Linear Functions 1.4 Equations of Lines and Linear Models 1.5 Linear Equations and Inequalities

E N D
Chapter 1: Linear Functions, Equations, and Inequalities 1.1 Real Numbers and the Rectangular Coordinate System 1.2 Introduction to Relations and Functions 1.3 Linear Functions 1.4 Equations of Lines and Linear Models 1.5 Linear Equations and Inequalities 1.6 Applications of Linear Functions
1.4 Equations of Lines and Linear Models Point-Slope Form The line with slope m passing through the point (x1, y1) has equation
1.4 Examples Using Point-Slope • Example 1Using the Point-Slope Form • Find the slope-intercept form of the line passing through the points shown. (1, 7) and (3, 3) • Solution
1.4 Examples Using Point-Slope • Example 2Using the Point-Slope Form • The table below shows a list of points found on the line Find the equation of the line. Solution
1.4 Standard Form of the Equation of a Line Standard Form A linear equation written in the form where A, B, and C are real numbers, is said to be in standard form.
1.4 Equations of Lines in Ax + By = C Form • Graph Analytic Solution x-intercept: (2,0) y-intercept: (0,3) Graphing Calculator Solution
1.4 Parallel Lines Parallel Lines Two distinct nonvertical lines are parallel if and only if they have the same slope.
1.4 Parallel Lines Example Find the equation of the line that passes through the point (3,5) and is parallel to the line with equation Graph both lines in the standard viewing window. Solution Solve for y in terms of x.
1.4 Parallel Lines 10 10 -10 -10
1.4 Perpendicular Lines Perpendicular Lines Two lines, neither of which is vertical, are perpendicular if and only if their slopes have product –1.
1.4 Perpendicular Lines ExampleFind the equation of the line that passes through the point (3,5) and is perpendicular to the line with equation Graph both lines in the standard viewing window. Use slope from the previous example. The slope of a perpendicular line is
1.4 Perpendicular Lines 10 15 -15 -10
1.4 Modeling Medicare Costs • Linear Models and Regression • Discrete data points can be plotted and the graph is called a scatterdiagram. • Useful when analyzing trends in data. • e.g. Estimates for Medicare costs (in billions)
1.4 Modeling Medicare Costs • Scatter diagram where x = 0 corresponds to 2002, x = 1 to 2003, etc. Data points (0, 264), (1, 281), (2, 299), (3, 318), (4, 336) and (5, 354) b) Linear model – pick 2 points, (0, 264) and (3, 318) c) Predict cost of Medicare in 2010.
1.4 The Least-Squares Regression Line • Enter data into lists L1 (x list) and L2 (y list) • Least-squares regression line: LinReg in STAT/CALC menu
1.4 Correlation Coefficient • Correlation Coefficient r • Determines if a linear model is appropriate • range of r: • r near +1, low x-values correspond to low y-values and high x-values correspond to high y-values. • r near –1, low x-values correspond to high y-values and high x-values correspond to low y-values. • means there is little or no correlation. • To calculate r using the TI-83, turn Diagnostic On in the Catalog menu.
1.4 Application of Least-Squares Regression • ExamplePredicting the Number of Airline Passengers Airline Passengers (millions) Airport 1992 2005
1.4 Application of Least-Squares Regression 14 • Scatter Diagram • Linear Regression: • Prediction for 2005 at Raleigh-Durham International using this model: FAA’s prediction: 10.3 million 0 6 14 0 6