Download

1 / 49
490 likes | 497 Vues
COMPOSITION ? (QUALITATIVE ANALYSIS). HOW MUCH ? (QUANTITATIVE ANALYSIS). WHAT FORM ? (SPECIATION). Mass Spectrometry. Topic I. Present Detector Technology – Faraday Cups. Gain is stable and precisely known (gain=1) Bandwidth is consistent with use in sector-based mass spectrometry

E N D
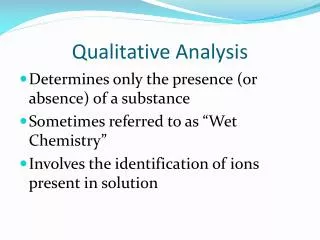
COMPOSITION ? (QUALITATIVE ANALYSIS) HOW MUCH ? (QUANTITATIVE ANALYSIS) WHAT FORM ? (SPECIATION)
Mass Spectrometry Topic I
Present Detector Technology – Faraday Cups • Gain is stable and precisely known (gain=1) • Bandwidth is consistent with use in sector-based mass spectrometry • Useful for Iion 10-15 amp (1 ion/sec 1.6 10-19 amps) • Implies that one needs about 6250 ions/sec for detection by Faraday cup Collector Electrode Faraday Cage Out to amplifier Load Resistor Out to amplifier
High Z output “FARADAY ELECTRODE”
Incident Ion Secondary Electrons Electron Multiplier Detector
Electron Multiplier Detector Electron multiplier has a gain that is dependent upon the mass or kinetic energy of the incoming ion. Detection Efficiency 0 Mass (m/z)
Electron Multiplier Detector 100 80 60 Detection Efficiency (%) 40 20 0 10 102 104 103 Energy (eV)
Focal Plane Array hn - e PtSi Photoactive Layer In bump bonds Silicon Multiplexer Individual preamps for each pixel
RESET 36 fF “FARADAY CUP” MUX 4.4 V / e-- 20 e-- read noise @ 77 K
Mattauch-Herzog Mass Spectrometer Geometry Ion Source Magnetic Sector - + Electrostatic Sector Array Detector on Focal Plane
Design Specifications • Noise - 5 electrons read noise (highest gain) • 39.6 microvolts / electron (highest gain) • Well size - 80,000 e to 16,000,000 e • 50 micron pitch • Read rate - 1 mega sample per second into 30pfd &10kohm • Nondestructive / Destructive Readout
RESET Gain 990 f F F 10 f “FARADAY ELECTRODE” MUX
Detection Limit 2.5 electrons of read noise with NDRO 8 IONS ! & we are still optimizing it !! Keep tuned
35 lbs. 75 watts GC, Pumps Mass spec. etc. CMS
Ion Mobility Spectrometry Applications Using Ion Mobility Spectrometers Ion Mobility Spectrometer Field-Portable detection of chemical warfare agents IMS is a technique that is being employed to solve problems where portable instrumentation and ruggedness is necessary Detection of explosives, nerve agents, toxins, and other hazardous chemicals at safety inspection stations and in the environment • New Instruments Demand Lower Detection Limits • Must Operate through a Wide Range of Temperatures • Must Operate at Atmospheric Pressure • High S/N Ratio Structural conformation studies of proteins, polymers, and various other molecules
Ion Mobility Spectrometer Electric Field Ionization Chamber Drift Region b- Faraday Plate Ion Shutter Drift Gas Inlet Gas Inlet Gas Outlet Drift Rings
Relationship of Ion Mobility to Molecular Terms d Mobility: K = Drift Velocity: vd = K E td E 1 + D e p 3 1 2 1 + K= p r2W N T 16 M k m E Electric Field Strength td Drift Time m Ion Mass (analyte) N Number Density T Temperature W Collision Integral d Drift Path Length e Unit Charge M Molecular Mass (drift gas) k Boltzmann-Constant r Minimum in Potential Curve DCorrection Term
High Z output “FARADAY ELECTRODE”
RESET 8 fF “FARADAY ELECTRODE” MUX
1-31-05 25pg TNT -1825VDC Emco PS, 90C 100/50 ml/min Cl-/Air Filament, inj 125C. Filters OFF Resolution 84. Run a baseline noise 0.005 S/N=30 Detection Limit = 2.5 pg
5pg TNT 95 oC 25V Injector Block 0.85A Filament, 1200 us Pulse B.C. FIRW on (0.9 pg Det. Lmt.)
8in. 12 in. 18 in. Proposed Vehicle Based IMS
47 attograms in single sweep Intensity (ADU) RDX Detection Limit = 5 attograms RDX e- peak Time (ms)
Conclusions • CTIA is ideal for IMS • Fast (1 MHz or higher per pixel) • Low read noise • 1000 x sensitivity improvement over current micro-IMS device. • Expect further improvement with differential devices and cooling. • Don’t need low secondary electron yield coatings or exotic geometries for IMS.
Conclusions • CTIA is ideal for IMS • Fast (1 MHz or higher per pixel) • Low read noise • 1000 x 10,000 x sensitivity improvement over current micro-IMS device. • Expect further improvement with differential devices and cooling. • Don’t need low secondary electron yield coatings or exotic geometries for IMS.
Miniature Optical Bench 14mm How do you make an optical bench that is just 14mm long?
Axsun’s Handheld Substance ID Solutions Raman Handheld Substance Identifier Concept Fiber Optics Raman Probe TEC High Power Laser Diode TEC Spectrometer Battery
Raman Spectral Range Dependence on Excitation l 224.3nm 246nm 244.0nm 256.5nm 270.4nm 488.0nm 540.8nm 606.4nm 785.0nm 931.2nm 1144.3nm 980nm 1225nm 1450nm 0 2000 4000 Excitation l Raman Shift (cm-1)
NIR Spectroscopy/Imaging With Focal Plane Arrays • 900-1700 nm is critical “molecular fingerprint” region for scientific research and analysis of food, pharmaceutical, chemical, and plastic products. • Ideal NIR sensor will have high QE between 900-1700 nm, high sensitivity, high dynamic range.
Photoelectrons CMOS Imager Light Photocathode Video Output Photon-Processor™Extreme Low Light Level Digital Video Imager • Low Cost • Patented Technology • Camera Electronics On-chip Photon-Processor™ • Day/Night Operation • SXGA (1024 X 1280) Resolution • Low Power <600 Mw @ 3 VDC
Photoelectrons CMOS Imager Light Photocathode Video Output
Complete NIR Spectrometer Spectrometer Sample PC and software Wired or wireless Butterfly packages Wavelength Reference DSP processor SLED source MEMS tunable filter Power Reference 24-bit A/D converters Single element InGaAs detector Amp Blue lines are light, red are electrical Probe or optics
Reference Block Diagram • WARM (Wavelength & Amplitude Reference Module) • Ultra stable beamsplitters tap off known quantities of light • Absolute wavelength reference provided by an integrated quartz etalon and a miniature acetylene gas cell that are temperature controlled to 0.1oC • Amplitude reference provided by matched single element photodetectors that divide out responses from every point of a scan
Tunable laser spectrometer, in portable package • With embedded PC and sample interface Sample interface LCD Display Tunable laser spectrometer