Download
1 / 17
170 likes | 175 Vues
This article discusses the use of vertical graph analytics in sentiment analysis, covering topics such as connectivity component partitioning, community mining, graph clustering, and more.

E N D
Sentiment Analysis Notes (summarizes Satuday Notes involving Sentiment Analysis and preliminaries) Vertical Graph AnalyticsMost complex data is modelled as a graph or hypergraph (a table is a graph without edges, so ALL data is modelled as a graph!). We strive for max speed and accuracy in our graph analytics by using vertical structure. We consider the following topics: • Vertical structuring of graph data (Edge pTree (E), PathPtree(PP), ShortestPathTrees…). • Connectivity Component Partitioning. • Community Mining (k-plexes, which include cliques as 0-plexes; k-cores, Density-communities, Degree-communities, • Community existence theorems (determine if a given Induced SubGraph is a community) and community mining algorithms (find all communities) include: Vertex Count based Existence Thms. Inheritance (downward or upward closure based existence thms). Density Difference. Degree Difference. • Graph and HyperGraph Clustering (Community based, Vertex betweenness, Edge betweenness Clustering). • MultiPART graphs, HyperGraphs, MultiPART Hypergraphs nnd the Clique Tree construct (cTree) for MultiPART graphs and hypergraphs. IntDeg(C) kCint = vC kvint PP(G), the Path Ptree of graph, G, is a vertical representation of all paths in G and is used to find diameter, shortest paths, communities, motifs... k-plex existence: C = k-plex iff vC|Cv| |VC|2–k2 k-plex inheritance: An induced subgraph of a k-plex is a k-plex. By modifying data structures (from horizontal to vertical) the analytics fit hardware strengths and allow do NP-hard/complete problems. k-core inheritance:If cover by induced k-cores, G is k-core. k-core existence:C = k-core iff vC,|VC| k. A Path is a sequence of edges connecting a sequence of vertices, distinct except for end-vertices. A Simple Path (assumed) excludes loops, (v,v). We’ll always program using the pop-count (produces 1-counts during ANDs/ORs for free, timewise). C is a clique iff all C level 1counts are |VC|-1. ExtDeg(C), kCext =vC kvext vC, kvint =#edges v to C; kvext=#edges v to C’. COMMUNITIES (=~ a subgraph with more edges than expected): A k-plex is a [max] subgraph in which each vertex is adjacent to all subgraph vertices except at most k of them. A 0-plex is called a clique. A k-core is a [max] subgraph in which each vertex is adjacent to at least k subgraph vertices. An n-clique is a [max] subgraph s.t. the geodesic distance between any vertex pair is n. An n-clan is a [max] n-clique with diameter n. An n-club is [max] subgraph of diam=n. External Density of C δext(C)= edges(C,C’)|/(nc(n-nc)). InternalDensity of C δint(C)=|edges(C,C)|/(nc(nc−1)/2) ExtDenC*n(n-nC)/2=ExtDegC IntDenC<<IntDegC. Clique Existence: When is an induced SG a clique? Edge Count existence thm (EC): |EC||PUC|=COMB(|VC|,2)|VC|!/((|VC|-2)!2!) SubGraph existence theorem (SG): (VC,EC) is a k-clique iff every induced k-1 subgraph, (VD,ED) is a (k-1)-clique. A Clique Mining alg: Finds all cliques in a graph- uses an ARM-Apriori-like downward closure property: CLQkkCliqueSet, CCLQk+1Candk+1CliqueSet By SG, CCLQk+1= all s of CLQk-pairs having k-1 common vertices. Let CCCLQk+1 be a union of two k-cliques with k-1 common vertices. Let v,w be the kth vertices of the k-cliques, then CCLQk+1 iff (PE)(v,w)=1. (Just need to check a single bit in PE.) A good tradeoff between large δint(C) and small δext(C) is goal of density community mining algs. A simple approach is to maximize differences. Density Difference alg for Communities: δint(C)−δext(C) >Thresh? Degree Difference kCint – kCext> Thresh? Easy to compute even for Big Graphs. Giant Yahoo Data Dump Aims to Help Computers Know What You Want: (see “Here’s What Developers Are Doing With Google’s AI Brain”).
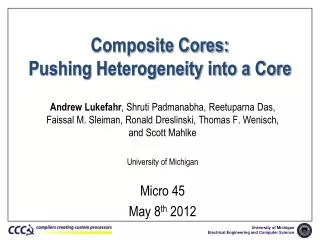
3 3 6 4 8 8 a e c 5 4 6 3 3 AN pTree Ct Complex Graph Structures: The vertex-labelled, edge-labelled graph AN 1 2 3 4 5 6 7 8 9 10 11 12 13 14 15 16 17 18 1 2 3 4 5 6 7 8 9 10 11 12 13 14 TS 1 1 0 1 0 0 0 0 0 0 0 0 0 0 0 0 0 0 1 1 1 0 0 0 0 0 0 0 0 0 0 0 0 0 0 0 1 1 1 1 1 1 0 0 0 0 0 0 0 0 0 0 0 0 1 0 1 1 1 0 0 0 0 0 0 0 0 0 0 0 0 0 1 1 1 1 1 1 1 0 1 0 0 0 0 0 0 0 0 0 1 1 1 1 0 1 1 1 0 0 0 0 0 1 0 0 0 0 0 1 1 1 1 0 1 0 1 1 0 0 1 1 1 0 0 0 1 1 1 1 0 1 1 1 1 1 1 1 1 0 1 1 0 0 1 0 1 0 0 0 0 1 1 1 1 1 1 1 0 1 1 1 0 0 0 0 0 0 0 0 0 0 1 1 1 1 1 0 0 0 0 0 0 0 0 0 0 0 0 0 0 0 0 1 1 0 1 1 0 0 0 0 0 0 0 0 0 1 1 1 1 1 1 0 0 0 0 0 0 0 0 0 0 0 0 0 0 1 1 1 0 0 0 0 0 0 0 0 0 0 0 0 0 0 0 1 1 1 0 0 0 0 We can interpret this structure many ways, 1. as a relationship with entity tables; 2. as a AN[lysist] Table with attributes, the AN attributes (SA, Ct, C, Sal) plus each TickerSymbol pTree as an additional attribute (the TS attributes (Dow?,Ct,BHS,SA) are not captured in this interpretation); 3. as a T[icker] S[ymbol] or Stock Table with attributes, the TS attributes (Dow?, Ct, BHS, SA) plus each Analyst pTree as an additional attribute (the AN attributes (SA, Ct, F, Sal) are not captured in this interpretation); 1 0 0 1 1 1 1 0 1 0 0 1 1 0 Dow? ANalystTickerSymbolRelationship with labels H B B SB B SS S S H H B B B SB Buy-Hold-Sell 1 3 1 3 3 1 2 3 1 1 2 2 3 3 TS SA TS pTree Ct 8 7 8 7 4 4 4 3 4 4 4 6 7 8 5 2 2 2 AN SA 3 3 2 1 3 2 3 1 3 2 2 1 1 1 3 1 2 3 Sal 7 5 7 6 2 1 6 4 5 7 4 5 6 3 4 1 6 1 C 2 3 0 1 0 1 0 0 0 0 0 0 2 0 0 0 0 3 In full pTree form: 1 0 0 1 1 1 1 0 1 0 0 1 1 0 Dow? 0 0 0 0 1 1 1 1 1 0 0 0 0 0 C3 0 0 1 1 0 0 0 1 1 1 1 1 0 0 C2 1 1 1 0 0 0 1 1 0 0 0 1 1 1 C1 1 1 0 0 0 0 0 0 0 1 0 0 1 1 C0 0 0 0 0 0 1 0 0 0 0 0 0 0 0 SS 0 0 0 0 0 0 1 1 0 0 0 0 0 0 S 1 0 0 0 0 0 0 0 1 1 0 0 0 0 H 0 1 1 0 1 0 0 0 0 0 1 1 1 0 B We can include this relationship with other relationships sharing entities by using the RoloDex Model (next slide). 0 0 0 1 0 0 0 0 0 0 0 0 0 1 SB 0 1 0 1 1 0 1 1 0 0 1 1 1 1 SA1 1 1 1 1 1 1 0 0 1 1 0 0 0 1 SA0 S A 1 1 1 0 1 1 0 1 1 1 0 0 1 1 1 1 1 0 1 S A 0 0 1 0 1 0 0 0 0 0 0 0 0 1 0 1 0 0 0 C 3 1 0 1 0 0 0 0 0 0 0 0 0 0 1 0 0 0 0 C 2 0 1 0 1 1 1 1 0 1 1 1 1 1 0 1 0 0 0 C 1 0 1 0 1 0 0 0 1 0 0 0 1 1 0 0 1 1 1 C 0 0 1 0 1 0 0 0 0 0 0 0 0 1 0 1 0 0 0 S 2 1 1 1 1 0 0 1 1 1 1 1 1 1 0 1 0 1 0 S 1 1 0 1 1 1 0 1 0 0 1 0 0 1 1 0 0 1 0 F 1 1 0 1 0 0 0 0 0 0 0 0 0 0 0 0 0 0 AN 1 2 3 4 5 6 7 8 9 10 11 12 13 14 15 16 17 18 S 0 1 1 1 0 0 1 0 0 1 1 0 1 0 0 0 1 0 1 1 2 3 4 5 6 7 8 9 10 11 12 13 14 TS The graph could be 3D, 4D (i.e., edges are triples, quadruples), etc. 2 1 0 2 0 2 2 0 0 0 0 0 0 0 0 0 0 0 3 3 2 1 0 0 0 0 0 0 0 0 0 0 0 0 0 0 2 3 3 2 2 3 0 0 0 0 0 0 0 0 0 0 0 0 3 1 3 3 3 1 0 0 0 0 0 0 0 0 0 0 0 0 2 2 2 2 2 2 2 0 2 0 0 0 0 0 0 0 0 0 1 1 1 1 0 1 1 1 0 0 0 0 0 1 0 0 0 0 1 3 3 3 2 1 1 1 0 0 0 0 0 2 0 0 0 1 2 2 2 1 0 2 1 2 1 2 2 2 1 0 2 2 0 0 2 1 3 1 0 0 0 2 2 2 1 2 1 2 0 1 3 3 2 2 1 2 2 0 0 0 1 2 3 3 3 3 3 1 2 1 0 0 0 0 0 0 0 0 0 0 0 0 0 2 1 0 2 1 0 0 0 0 0 1 1 1 2 3 3 3 3 3 3 1 1 1 0 0 0 0 0 0 0 0 0 0 0 2 2 2 0 0 0 0 0 0 0 0 0 1 1 2 1 2 1 3 3 3 1 1 1 1 10 01 00 10 01 01 01 00 00 00 00 00 00 00 00 00 00 00 11 11 10 01 00 00 00 00 00 00 00 00 00 00 00 00 00 00 10 11 11 10 10 11 00 00 00 00 00 00 00 00 00 00 00 00 11 01 11 11 11 01 00 00 00 00 00 00 00 00 00 00 00 00 10 10 10 10 10 10 10 00 10 00 00 00 00 00 00 00 00 00 01 01 01 01 00 01 01 01 00 00 00 00 00 10 00 00 00 01 01 11 11 11 10 01 10 01 10 10 00 00 01 01 01 01 01 01 10 10 10 01 00 10 01 10 01 10 10 10 01 00 10 10 00 00 10 01 11 01 00 00 00 10 10 10 01 10 01 10 00 01 11 11 10 10 01 10 10 00 00 00 01 10 11 11 11 11 11 01 10 01 00 00 00 00 00 00 00 00 00 00 00 00 00 10 01 00 10 01 00 00 00 00 00 01 01 01 10 11 11 11 11 11 11 01 01 01 00 00 00 00 00 00 00 00 00 00 00 10 10 10 00 00 00 00 00 00 00 00 00 01 01 10 01 10 01 11 11 11 01 01 01 01 The graph could also be edge labelled. A convenient way to capture edge labels is by making the cell content of each matrix cell into the label structure rather than just a yes/no bit. As a simple but pertinent example, suppose we have a 0-3 rating of each Analyst-Stock pair which measure how much that Analysts know about that stock. We just change each bit to a decimal number in [0,3] (or bitslice those using two bits instead of on, so that the matrix columns are 2-bit pTreeSets rather than just one pTree). If C measures the “Correctness Level” of the Analyst over recent days or weeks over all stock (e.g., based on backward analysis of previous sentiment analysis and the actual performance of the stock) and the cell numbers measure the correctness of that Analyst on that Stock, then a signal might be to mask C>=2 and for those Analysts find the average Correctness for each stock, then mask out those Stock for which the number of Analysts is between two thresholds (want a high average but also more than one analyst but not too many).
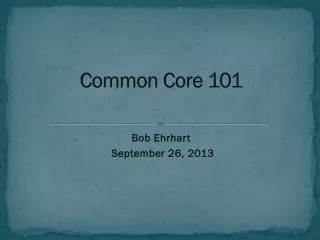
The Universal Entities-Relationships Model Everything is related! 16 6 itemset itemset 5 Item 4 3 2 1 People Author 2 1 2 1 3 2 3 2 3 4 4 3 5 5 4 4 5 6 7 ItemSet ItemSet antecedent Customer, invester 1 1 1 1 1 1 1 1 5 6 16 1 1 1 2 1 1 1 1 Enroll 1 1 1 3 Doc 1 4 movie 2 Course 3 term G 3 0 0 0 5 0 4 0 5 0 0 0 1 0 1 2 3 4 5 6 7 Doc 0 0 3 0 0 customer rates movie 0 2 2 0 3 4 0 0 0 0 1 0 0 1 0 0 4 0 0 5 0 t Stock 3 2 1 1 1 2 2 3 3 PI PI ShareStem termterm rel CellLabel=stem Gene 4 4 5 5 6 6 7 7 1 1 3 Exp 0 0 0 0 1 0 0 0 1 0 0 0 0 0 0 0 0 customer rates movie as 5 relationships 0 0 0 0 0 0 0 0 0 0 0 0 0 0 0 1 0 Day Investors recommend stocks on days (y/n) (tripartite hypergraph) Every Entity (Gene, Term, Experiment, Person, Document, Item, Stock, Course, Movie) has an EntityTable of many descriptive attributes (columns). They aren’t shown. E.g. descriptive columns of Stocks(Dow?, Count, BHS, SA) and Analysts(SA,Count,Female?,SalaryInBillions), not shown. 1 1 1 1 Conf(AB) =Supp(AB)/Supp(A) Supp(A) = CusFreq(ItemSet) Investors recommend stocks (y/n) (bipartite graph) Friends relationship Tweets are Documents, so the Tweet-Tweeter relationship is a Document-Author relationship (Tweetee, hashtag, etc. are Edge Labels). BUYS In looking for signals that no one else uses: What if an Investor BUYS an island in the Mediterranean? What if an Investor’s best friend buys lots of stock in an Online University? TermDocument AuthDoc Gene-gene rel (ppi’s) docdoc People Expgene expPI
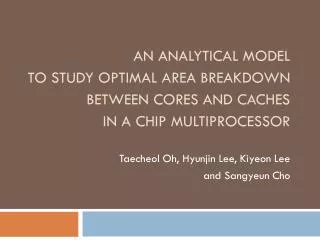
1 1 1 1 1 1 1 0 1 1 0 0 0 0 0 8 2 1 1 1 0 1 1 1 1 0 0 0 0 0 0 7 3 0 1 1 1 1 1 1 1 1 0 0 0 0 0 8 4 1 0 1 1 1 1 1 1 0 0 0 0 0 0 7 5 0 0 1 1 1 0 1 0 0 0 0 0 0 0 4 6 0 0 1 0 1 1 0 1 0 0 0 0 0 0 4 7 0 0 0 0 1 1 1 1 0 0 0 0 0 0 4 8 0 0 0 0 0 1 0 1 1 0 0 0 0 0 3 9 0 0 0 0 1 0 1 1 1 0 0 0 0 0 4 1 0 a 0 0 0 0 0 0 1 1 1 0 0 1 0 0 4 1 1 b 0 0 0 0 0 0 0 1 1 1 0 1 0 0 4 1 2 c 0 0 0 0 0 0 0 1 1 1 0 1 1 1 6 1 3 d 0 0 0 0 0 0 1 1 1 1 0 1 1 1 7 1 4 e 0 0 0 0 0 1 1 0 1 1 1 1 1 1 8 H 1 5 f 0 0 0 0 0 0 1 1 0 1 1 1 0 0 5 1 6 g 0 0 0 0 0 0 0 1 1 0 0 0 0 0 2 1 7 h 0 0 0 0 0 0 0 0 1 0 1 0 0 0 2 1 8 i 0 0 0 0 0 0 0 0 1 0 1 0 0 0 2 I Btwn2.1 on bipartite G9 16 g A 1 1 0 1 0 0 0 0 0 0 0 0 0 0 0 0 0 0 3 B 1 1 1 0 0 0 0 0 0 0 0 0 0 0 0 0 0 0 3 C 1 1 1 1 1 1 0 0 0 0 0 0 0 0 0 0 0 0 6 D 1 0 1 1 1 0 1 0 0 0 0 0 0 0 0 0 0 0 5 E 1 1 1 1 1 1 1 0 1 0 0 0 0 0 0 0 0 0 8 F 1 1 1 1 1 1 1 0 1 0 0 0 0 0 0 0 0 0 8 G 0 1 1 1 1 0 1 0 1 1 0 0 1 1 1 0 0 0 1 0 H 1 1 1 1 0 1 0 1 1 1 1 1 1 0 1 1 0 0 1 3 I 1 0 1 0 0 0 0 1 1 1 1 1 1 1 0 1 1 1 1 2 J 0 0 0 0 0 0 0 0 0 0 1 1 1 1 1 0 0 0 5 K 0 0 0 0 0 0 0 0 0 0 0 0 0 1 1 0 1 1 4 L 0 0 0 0 0 0 0 0 0 1 1 1 1 1 1 0 0 0 6 M 0 0 0 0 0 0 0 0 0 0 0 1 1 1 0 0 0 0 3 N 0 0 0 0 0 0 0 0 0 0 0 1 1 1 0 0 0 0 3 A B C D E F G H I J K L M N E 1 2 3 4 5 6 7 8 9 a b c d e f g h i 8 x y btw H 3 103 H 1 103 I e 95 I 3 95 I 1 95 H d 90 H 2 90 H 4 90 I d 83 G 3 79 G e 79 H c 77 I c 71 G 4 69 G 2 69 G d 69 H f 64 E 3 63 E 1 63 F 1 63 F 3 63 F e 63 E 2 55 E 4 55 F 4 55 F 2 55 H 7 55 H a 51 H b 51 H 6 51 H 9 51 G f 49 C 1 47 C 3 47 I b 47 I 9 47 I a 47 L e 47 C 4 41 C 2 41 L d 41 D 1 39 D 3 39 G a 39 G 5 39 G 7 39 G 9 39 J e 39 H 8 38 I 8 35 L c 35 D 4 34 J d 34 E 7 31 E 5 31 E 6 31 E 9 31 F 6 31 F 7 31 K e 31 J c 29 L f 29 H g 25 J f 24 11 b 18 i G9 9 1 6 10 a 17 h F A 1 23 B 3 23 B 1 23 C 6 23 C 5 23 F 8 23 I i 23 I g 23 I h 23 L a 23 L b 23 M e 23 N e 23 A 2 20 A 4 20 B 2 20 M d 20 N d 20 D 5 19 J b 19 K f 19 M c 17 N c 17 K h 7 K i 7 E 12 c 7 C 3 A L M 2 D K 15 f J B 4 13 d N G 5 G9: Bipartite graph of the Southern Women Event Participation. Women are numbers (18), events are letters (14) (89 edges) Or Investors are numbers, stocks are letters in a recommends graph 14 e At this point, Investors {2,3} recommend Stock {A}; Investors {15,17,18} recommend Stock {K}; Investors {12,13} recommend Stocks {M,N} After all between-ness2 = 20s are deleted, we have Investors {15,17,18} recommend Stock {K}; Investor {12} recommend Stocks {M,N} After all between-ness2 = 19s are deleted, we have Investors {17,18} recommend Stock {K}; Investor {12} recommend Stocks {M,N} After all between-ness2 = 17s are deleted, we have Investors {17,18} recommend Stock {K}. If one believes high Between-ness2 measure bad recommendation then the best strategy is to buy stock K (assuming you like Investors 17 and 18. This can be arrived at much simpler by working up from the bottom of the Btwn2 sorted list. How can we involve Sentiment Analysis? SA is a label on each vertex at this time. The simplest SA-based measure to use is probably RecommendationQuality1hk = Phk*(SAh+Sak) which assigns edged labels based on SA only. Then we could define RecommendationQuality2hk = (1/SAh))|Ph-1| + (1/SAk)|Pk-1| + (1/SAh)|Ph-1|*(1/SAk)|Pk-1| at no added cost and do the above again. If SA values can be zero, we use something like 1/(1+SA) instead of just 1/SA. These RQs involve SAs + Btwn-nesses One could argue for edges at the top (contrarian strategy?) Max btwn2 (or RQ2) edges stand most between the crowds of recommendations????? Another Contrarian approach would be to isolate high SA Investors recommending low SA stocks (and doing so alone)
(1/SAh)|Ph-1|+(1/SAk)|Pk-1|+(1/SAh)|Ph-1|*(1/SAk)|Pk-1| H I BtwnSA1 on bipartite G9 16 g S I btnSA1 H c 24.5 F 8 23 F e 21 F 3 21 F 6 19 F 7 19 I c 18.2 F 1 18.2 J c 17 N c 17 F 4 16.6 F 2 16.6 L c 15 H 8 11.7 E 3 11.3 H 3 10.6 E 7 10.2 E 6 10.2 E 1 9.8 H 7 9.62 H b 9.62 H 6 9.62 H a 9.62 H d 9.62 H 1 9.2 E 2 8.9 E 4 8.9 I 8 8.6 H 4 8.35 H 2 8.35 E 5 8 E 9 8 I e 7.8 I 3 7.8 H 9 7.5 M c 7.4 J e 7.25 N e 7.25 I b 7 I d 7 I a 7 G e 6.7 G 3 6.7 I 1 6.68 H f 6.65 J d 6.5 J b 6.5 N d 6.5 C 3 6.33 L e 6.33 G d 6 G 7 6 G a 6 K e 5.87 C 6 5.66 L d 5.66 L a 5.66 L b 5.66 C 1 5.4 I h 5.4 I 9 5.4 G 2 5.16 G 4 5.16 C 2 4.86 C 4 4.86 G 5 4.6 G 9 4.6 J f 4.4 C 5 4.33 H g 4.31 G f 4.04 K h 4 This is a contrarian strategy. (low BtwnSA2). At this point, Investors 2,4 recommend Stock A and Investor 2 recommends Stock B 8 11 b 18 i G9 9 1 6 10 a 17 h F E 12 c 7 C 3 A L M 2 D K 15 f J B 4 13 d N G 5 G9: Bipartite graph of the Southern Women Event Participation. Women are numbers (18), events are letters (14) (89 edges) Or Investors are numbers, stocks are letters in a recommends graph 14 e 1 2 3 4 5 6 7 8 9 a b c d e f g h i (SA^-1)*(Ct-1) v SA Ct A 1 1 0 1 0 0 0 0 0 0 0 0 0 0 0 0 0 0 0.5 4 3 B 1 1 1 0 0 0 0 0 0 0 0 0 0 0 0 0 0 0 0.5 4 3 C 1 1 1 1 1 1 0 0 0 0 0 0 0 0 0 0 0 0 1.6 3 6 D 1 0 1 1 1 0 0 0 0 0 0 0 0 0 0 0 0 0 0.6 5 4 E 1 1 1 1 1 1 1 0 1 0 0 0 0 0 0 0 0 0 3.5 2 8 F 1 1 1 1 0 1 1 1 0 0 0 0 0 1 0 0 0 0 7 1 8 G 0 1 1 1 1 0 1 0 1 1 0 0 1 1 1 0 0 0 1.8 5 10 H 1 1 1 1 0 1 1 1 1 1 1 1 1 0 1 1 0 0 3.2 4 14 I 1 0 1 0 0 0 0 1 1 1 1 1 1 1 0 1 1 1 2.2 5 12 J 0 0 0 0 0 0 0 0 0 0 1 1 1 1 1 0 0 0 2 2 5 K 0 0 0 0 0 0 0 0 0 0 0 0 0 1 1 0 1 1 1.5 2 4 L 0 0 0 0 0 0 0 0 0 1 1 1 1 1 1 0 0 0 1.6 3 6 M 0 0 0 0 0 0 0 0 0 0 0 1 1 1 0 0 0 0 0.4 5 3 N 0 0 0 0 0 0 0 0 0 0 0 1 1 1 0 0 0 0 2 1 3 (SA^-1)*(Ct-1) 1.4 1.2 1.7 1.2 1 1.5 1.5 2 1 1.5 1.5 5 1.5 1.7 0.8 0.2 1 0.5 SA 5 5 4 5 3 2 2 1 3 2 2 1 4 4 5 4 1 2 Ct 8 7 8 7 4 4 4 3 4 4 4 6 7 8 5 2 2 2 I i 3.8 L f 3.8 K f 3.5 D 3 3.4 B 3 3.12 I g 3 M e 2.85 D 1 2.84 K i 2.75 A 1 2.6 B 1 2.6 D 4 2.52 M d 2.5 A 2 2.3 A 4 2.3 B 2 2.3 D 5 2.2
SAh|Ph-1|+SAk|Pk-1|+SAh|Ph-1|*SAk|Pk-1| Delete from top H I BtwnSA2t on bipartite G9 16 g S I btnSA2 I 1 2015 H 1 1907 H 2 1642 H 4 1642 I e 1623 I 3 1623 H 3 1536 G 4 1425 G 2 1425 I d 1399 G e 1333 G 3 1333 H d 1324 G d 1149 H f 1112 G f 965 C 1 575 D 1 575 I 9 559 E 1 539 H 9 529 C 2 495 C 4 495 D 4 495 E 4 464 E 2 464 C 3 463 D 3 463 L e 463 G 9 459 G 5 459 E 3 434 L d 399 I a 391 I b 391 H 6 370 H 7 370 H a 370 H b 370 I c 335 L f 335 A 1 323 B 1 323 G a 321 G 7 321 M e 318 H c 317 F 1 287 I g 279 A 4 278 A 2 278 B 2 278 M d 274 H g 264 B 3 260 J e 260 F 4 247 F 2 247 F 3 231 F e 231 J d 224 K e 202 J f 188 I i 167 I 8 167 C 5 159 D 5 159 H 8 158 E 5 149 E 9 149 K f 146 This is a contrarian strategy. (low BtwnSA2). At this point, Investors 6,7 and 8 recommend Stock F and Investors 17,18 recommend Stock K and investors 1,2 recommend Stocks J,N 8 11 b 18 i G9 9 1 6 10 a 17 h F E 12 c 7 C 3 A L M 2 D K 15 f J B 4 13 d N G 5 G9: Bipartite graph of the Southern Women Event Participation. Women are numbers (18), events are letters (14) (89 edges) Or Investors are numbers, stocks are letters in a recommends graph 14 e 1 2 3 4 5 6 7 8 9 a b c d e f g h i SA*(Ct-1) v SA Ct A 1 1 0 1 0 0 0 0 0 0 0 0 0 0 0 0 0 0 8 4 3 B 1 1 1 0 0 0 0 0 0 0 0 0 0 0 0 0 0 0 8 4 3 C 1 1 1 1 1 1 0 0 0 0 0 0 0 0 0 0 0 0 15 3 6 D 1 0 1 1 1 0 0 0 0 0 0 0 0 0 0 0 0 0 15 5 4 E 1 1 1 1 1 1 1 0 1 0 0 0 0 0 0 0 0 0 14 2 8 F 1 1 1 1 0 1 1 1 0 0 0 0 0 1 0 0 0 0 7 1 8 G 0 1 1 1 1 0 1 0 1 1 0 0 1 1 1 0 0 0 45 5 10 H 1 1 1 1 0 1 1 1 1 1 1 1 1 0 1 1 0 0 52 4 14 I 1 0 1 0 0 0 0 1 1 1 1 1 1 1 0 1 1 1 55 5 12 J 0 0 0 0 0 0 0 0 0 0 1 1 1 1 1 0 0 0 8 2 5 K 0 0 0 0 0 0 0 0 0 0 0 0 0 1 1 0 1 1 6 2 4 L 0 0 0 0 0 0 0 0 0 1 1 1 1 1 1 0 0 0 15 3 6 M 0 0 0 0 0 0 0 0 0 0 0 1 1 1 0 0 0 0 10 5 3 N 0 0 0 0 0 0 0 0 0 0 0 1 1 1 0 0 0 0 2 1 3 SA*(Ct-1) 35 30 28 30 9 6 6 2 9 6 6 5 24 28 20 4 1 2 SA 5 5 4 5 3 2 2 1 3 2 2 1 4 4 5 4 1 2 Ct 8 7 8 7 4 4 4 3 4 4 4 6 7 8 5 2 2 2 C 6 111 I h 111 L a 111 L b 111 E 7 104 E 6 104 L c 95 N e 86 N d 74 M c 65 J b 62 F 7 55 F 6 55 J c 53 F 8 23 K i 20 N c 17 K h 13
SAh|Ph-1|+SAk|Pk-1|+SAh|Ph-1|*SAk|Pk-1| Del from the bottom H I BtwnSA2b on bipartite G9 16 g S I btnSA2 I 1 2015 H 1 1907 H 2 1642 H 4 1642 I e 1623 I 3 1623 H 3 1536 G 4 1425 G 2 1425 I d 1399 G e 1333 G 3 1333 H d 1324 G d 1149 H f 1112 G f 965 C 1 575 D 1 575 I 9 559 E 1 539 H 9 529 C 2 495 C 4 495 D 4 495 E 4 464 E 2 464 C 3 463 D 3 463 L e 463 G 9 459 G 5 459 E 3 434 L d 399 I a 391 I b 391 H 6 370 H 7 370 H a 370 H b 370 I c 335 L f 335 A 1 323 B 1 323 G a 321 G 7 321 M e 318 H c 317 F 1 287 I g 279 A 4 278 A 2 278 B 2 278 M d 274 H g 264 B 3 260 J e 260 F 4 247 F 2 247 F 3 231 F e 231 J d 224 K e 202 J f 188 I i 167 I 8 167 C 5 159 D 5 159 H 8 158 E 5 149 E 9 149 K f 146 At this point Investors=3,13 recommend Stocks G,H,I and 2,4,15 recommend H,G and 14 recommends G,I and 1 recommends H,I 8 At this point Investor1 still recommends H,I and Investor 2 recommends H. At this point Investor1 still recommends H,I. 11 b 18 i G9 9 1 6 10 a 17 h F E 12 c 7 C 3 A L M 2 D K 15 f J B 4 13 d N G 5 G9: Bipartite graph of the Southern Women Event Participation. Women are numbers (18), events are letters (14) (89 edges) Or Investors are numbers, stocks are letters in a recommends graph 14 e 1 2 3 4 5 6 7 8 9 a b c d e f g h i SA*(Ct-1) v SA Ct A 1 1 0 1 0 0 0 0 0 0 0 0 0 0 0 0 0 0 8 4 3 B 1 1 1 0 0 0 0 0 0 0 0 0 0 0 0 0 0 0 8 4 3 C 1 1 1 1 1 1 0 0 0 0 0 0 0 0 0 0 0 0 15 3 6 D 1 0 1 1 1 0 0 0 0 0 0 0 0 0 0 0 0 0 15 5 4 E 1 1 1 1 1 1 1 0 1 0 0 0 0 0 0 0 0 0 14 2 8 F 1 1 1 1 0 1 1 1 0 0 0 0 0 1 0 0 0 0 7 1 8 G 0 1 1 1 1 0 1 0 1 1 0 0 1 1 1 0 0 0 45 5 10 H 1 1 1 1 0 1 1 1 1 1 1 1 1 0 1 1 0 0 52 4 14 I 1 0 1 0 0 0 0 1 1 1 1 1 1 1 0 1 1 1 55 5 12 J 0 0 0 0 0 0 0 0 0 0 1 1 1 1 1 0 0 0 8 2 5 K 0 0 0 0 0 0 0 0 0 0 0 0 0 1 1 0 1 1 6 2 4 L 0 0 0 0 0 0 0 0 0 1 1 1 1 1 1 0 0 0 15 3 6 M 0 0 0 0 0 0 0 0 0 0 0 1 1 1 0 0 0 0 10 5 3 N 0 0 0 0 0 0 0 0 0 0 0 1 1 1 0 0 0 0 2 1 3 SA*(Ct-1) 35 30 28 30 9 6 6 2 9 6 6 5 24 28 20 4 1 2 SA 5 5 4 5 3 2 2 1 3 2 2 1 4 4 5 4 1 2 Ct 8 7 8 7 4 4 4 3 4 4 4 6 7 8 5 2 2 2 C 6 111 I h 111 L a 111 L b 111 E 7 104 E 6 104 L c 95 N e 86 N d 74 M c 65 J b 62 F 7 55 F 6 55 J c 53 F 8 23 K i 20 N c 17 K h 13
H I BtwnSA3 on bipartite G9 (1/SAH)|PH-1| + SAk|Pk-1| + (1/SAH)|PH-1|*SAk|Pk-1| Delete from the top. Strategies the result from this measure should be low SA stocks recommended by high SA Investors? (Twitter_SAInvestor_Contrarian?) 16 g S I btnSA3t F 1 287 F 2 247 F 4 247 F 3 231 F e 231 E 1 161 H 1 152 E 4 138.5 E 2 138.5 H 4 130.7 H 2 130.7 E 3 129.5 H 3 122.2 I 1 114.2 H d 105.2 C 1 95 I e 91.8 I 3 91.8 H f 88.25 J e 86 N e 86 G 2 85.8 G 4 85.8 C 4 81.66 C 2 81.66 G 3 80.2 G e 80.2 I d 79 C 3 76.33 L e 76.33 J d 74 N d 74 K e 71.5 G d 69 L d 65.66 J f 62 G f 57.8 D 1 56.6 F 7 55 F 6 55 L f 55 A 1 53 B 1 53 K f 51.5 D 4 48.6 A 4 45.5 A 2 45.5 B 2 45.5 D 3 45.4 E 9 44 E 5 44 B 3 42.5 H 9 41.5 M e 39.6 M d 34 I 9 31 E 6 30.5 E 7 30.5 H b 28.75 H 7 28.75 H a 28.75 H 6 28.75 G 5 27 G 9 27 C 5 25.66 H c 24.5 F 8 23 I b 21.4 I a 21.4 H g 20.25 J b 20 8 At this point Inv=17,18 recommend Stocks K,I. Inv 8 recommends I. 11 b 18 i G9 9 1 6 10 a 17 h F E 12 c 7 C 3 A L M 2 D K 15 f J B 4 13 d N G 5 G9: Bipartite graph of the Southern Women Event Participation. Women are numbers (18), events are letters (14) (89 edges) Or Investors are numbers, stocks are letters in a recommends graph 14 e 1 2 3 4 5 6 7 8 9 a b c d e f g h i (Ct-1)/SA v 1/SA SA Ct A 1 1 0 1 0 0 0 0 0 0 0 0 0 0 0 0 0 0 0.5 0.25 4 3 B 1 1 1 0 0 0 0 0 0 0 0 0 0 0 0 0 0 0 0.5 0.25 4 3 C 1 1 1 1 1 1 0 0 0 0 0 0 0 0 0 0 0 0 1.66 0.33 3 6 D 1 0 1 1 1 0 0 0 0 0 0 0 0 0 0 0 0 0 0.6 0.2 5 4 E 1 1 1 1 1 1 1 0 1 0 0 0 0 0 0 0 0 0 3.5 0.5 2 8 F 1 1 1 1 0 1 1 1 0 0 0 0 0 1 0 0 0 0 7 1 1 8 G 0 1 1 1 1 0 1 0 1 1 0 0 1 1 1 0 0 0 1.8 0.2 5 10 H 1 1 1 1 0 1 1 1 1 1 1 1 1 0 1 1 0 0 3.25 0.25 4 14 I 1 0 1 0 0 0 0 1 1 1 1 1 1 1 0 1 1 1 2.2 0.2 5 12 J 0 0 0 0 0 0 0 0 0 0 1 1 1 1 1 0 0 0 2 0.5 2 5 K 0 0 0 0 0 0 0 0 0 0 0 0 0 1 1 0 1 1 1.5 0.5 2 4 L 0 0 0 0 0 0 0 0 0 1 1 1 1 1 1 0 0 0 1.66 0.33 3 6 M 0 0 0 0 0 0 0 0 0 0 0 1 1 1 0 0 0 0 0.4 0.2 5 3 N 0 0 0 0 0 0 0 0 0 0 0 1 1 1 0 0 0 0 2 1 1 3 (Ct-1)*SA 35 30 28 30 9 6 6 2 9 6 6 5 24 28 20 4 1 2 SA 5 5 4 5 3 2 2 1 3 2 2 1 4 4 5 4 1 2 Ct 8 7 8 7 4 4 4 3 4 4 4 6 7 8 5 2 2 2 G 7 18.6 G a 18.6 I c 18.2 C 6 17.66 L a 17.66 L b 17.66 J c 17 N c 17 D 5 15 I g 15 L c 15 H 8 11.75 I i 8.6 I 8 8.6 M c 7.4 K i 6.5 I h 5.4 K h 4
H G9: Bipartite graph of Investors=numbers and stocks=letters in a recommends graph I BtwnSA3 on bipartite G9 16 g (1/SAH)|PH-1| + SAk|Pk-1| + (1/SAH)|PH-1|*SAk|Pk-1| Delete from the bottom. Strategies the result from this measure should be high SA stocks recommended by low SA Investors? (Twitter_SAStock_Contrarian?). S I btnSA3b F 1 287 F 2 247 F 4 247 F 3 231 F e 231 E 1 161 H 1 152 E 4 138.5 E 2 138.5 H 4 130.7 H 2 130.7 E 3 129.5 H 3 122.2 I 1 114.2 H d 105.2 C 1 95 I e 91.8 I 3 91.8 H f 88.25 J e 86 N e 86 G 2 85.8 G 4 85.8 C 4 81.66 C 2 81.66 G 3 80.2 G e 80.2 I d 79 C 3 76.33 L e 76.33 J d 74 N d 74 K e 71.5 G d 69 L d 65.66 J f 62 G f 57.8 D 1 56.6 F 7 55 F 6 55 L f 55 A 1 53 B 1 53 K f 51.5 D 4 48.6 A 4 45.5 A 2 45.5 B 2 45.5 D 3 45.4 E 9 44 E 5 44 B 3 42.5 H 9 41.5 M e 39.6 M d 34 I 9 31 E 6 30.5 E 7 30.5 H b 28.75 H 7 28.75 H a 28.75 H 6 28.75 G 5 27 G 9 27 C 5 25.66 H c 24.5 F 8 23 I b 21.4 I a 21.4 H g 20.25 J b 20 8 At this point Investors=1,2,3,4,14 recommend Stock F (with large gap). Note that Investors 1,2,3,4,14 are held in high regard on twitter but Stock F is held in low regard on twitter. Thus, I call it Twitter_SA Stock_Contrarian Strategy 11 b At this point Investors=1,2,3,4 recommend Stocks E,H as well. Stock E is also held in low regard on twitter but Stock H is held in fairly high regard on twitter??? 18 i G9 9 1 6 10 a 17 h F Other strategies: 1. Use BtwnSA4= SAH|PH-1|+(1/SAk)|Pk-1|+SAH|PH-1|*1/Sak)|Pk-1| and then delete from the top or bottom (giving alternative contrarian strategies to the last two). E 12 c 7 C 3 A L M Other strategies: 2. Eliminate the product term: BtwnSA5[6] = SAH|PH-1|+(1/SAk)|Pk-1| [(1/SAH)|PH-1|+SAk|Pk-1|] and then delete from the top or bottom (giving 4 more alternative contrarian strategies to the last two). 2 D K 15 f J B 4 13 d N G 5 Other strategies: 3. Strength of Investor recommendations (Strong Sell, Sell, Neutral, Buy, Strong Buy). One way to capture that info is have a pTreeSet of bit maps for each strength, each like the one below. This amounts to adding an external edge label (the between-nesses are internal edge labels derived the pTree Counts) and vertex labels, AdjacencyCount=pTreeCount (internal) and SA (external). 14 e Other strategies: 4. There may be lots of other edge labels and vertex labels, each of which (or combinations) open up lots of new possible strategies. Other strategies: 5. Add a Day dimension (say, the previous 5 days along with stock movement each day as a “face label” on the Stock-Day 2D face (independent of Investor). SA becomes a face label on Stock-Day and Investor-Day. Strength and Between-nesses are HyperEdge labels. 1 2 3 4 5 6 7 8 9 a b c d e f g h i (Ct-1)/SA v 1/SA SA Ct A 1 1 0 1 0 0 0 0 0 0 0 0 0 0 0 0 0 0 0.5 0.25 4 3 B 1 1 1 0 0 0 0 0 0 0 0 0 0 0 0 0 0 0 0.5 0.25 4 3 C 1 1 1 1 1 1 0 0 0 0 0 0 0 0 0 0 0 0 1.66 0.33 3 6 D 1 0 1 1 1 0 0 0 0 0 0 0 0 0 0 0 0 0 0.6 0.2 5 4 E 1 1 1 1 1 1 1 0 1 0 0 0 0 0 0 0 0 0 3.5 0.5 2 8 F 1 1 1 1 0 1 1 1 0 0 0 0 0 1 0 0 0 0 7 1 1 8 G 0 1 1 1 1 0 1 0 1 1 0 0 1 1 1 0 0 0 1.8 0.2 5 10 H 1 1 1 1 0 1 1 1 1 1 1 1 1 0 1 1 0 0 3.25 0.25 4 14 I 1 0 1 0 0 0 0 1 1 1 1 1 1 1 0 1 1 1 2.2 0.2 5 12 J 0 0 0 0 0 0 0 0 0 0 1 1 1 1 1 0 0 0 2 0.5 2 5 K 0 0 0 0 0 0 0 0 0 0 0 0 0 1 1 0 1 1 1.5 0.5 2 4 L 0 0 0 0 0 0 0 0 0 1 1 1 1 1 1 0 0 0 1.66 0.33 3 6 M 0 0 0 0 0 0 0 0 0 0 0 1 1 1 0 0 0 0 0.4 0.2 5 3 N 0 0 0 0 0 0 0 0 0 0 0 1 1 1 0 0 0 0 2 1 1 3 (Ct-1)*SA 35 30 28 30 9 6 6 2 9 6 6 5 24 28 20 4 1 2 SA 5 5 4 5 3 2 2 1 3 2 2 1 4 4 5 4 1 2 Ct 8 7 8 7 4 4 4 3 4 4 4 6 7 8 5 2 2 2 G 7 18.6 G a 18.6 I c 18.2 C 6 17.66 L a 17.66 L b 17.66 J c 17 N c 17 D 5 15 I g 15 L c 15 H 8 11.75 I i 8.6 I 8 8.6 M c 7.4 K i 6.5 I h 5.4 K h 4
H G9: Bipartite graph of Investors=numbers and stocks=letters in a recommends graph I BtwnSA4 on bipartite G9 16 g BtwnSA4 =SAH|PH-1|+(1/SAk)|Pk-1|+SAH|PH-1|*1/SAk)|Pk-1| and then delete fromthe top or bottom. S I btnSA4 N c 2.9 F 8 2.8 F 6 2.4 F 7 2.3 J c 2.3 K h 2.3 N e 2.2 L c 2.1 I 8 2.1 H 8 2.1 N d 2.1 F e 2.1 I c 2.1 M c 2.1 H c 2.0 I h 2.0 F 3 2.0 F 2 1.9 F 4 1.9 F 1 1.9 K i 1.8 E 6 1.8 E 7 1.8 J b 1.7 K e 1.7 H 6 1.6 J e 1.6 H 7 1.6 C 6 1.6 L b 1.6 J d 1.5 I i 1.5 K f 1.5 L a 1.5 L e 1.5 I b 1.5 J f 1.4 H b 1.4 G 7 1.4 E 5 1.4 I a 1.4 I e 1.4 M e 1.4 E 9 1.4 E 3 1.4 L d 1.4 H a 1.4 E 2 1.4 E 4 1.4 E 1 1.3 L f 1.3 I d 1.3 M d 1.3 I 9 1.3 I 3 1.3 H d 1.3 H 9 1.2 H 3 1.2 I 1 1.2 H 2 1.2 H 4 1.2 C 5 1.2 G a 1.2 G e 1.2 H 1 1.2 C 3 1.2 H f 1.2 C 2 1.2 C 4 1.2 From the top Investors held in low SA regard recommend Stocks held in low SA regard on twitter. So this is doubly contrarian. 8 From the bottom Investors held in high SA regard recommend Stocks held in high SA regard. So this is doubly non-contrarian We now go to the avg of the highest and lowest (=3.9/21.9) and get 3 highly regarded investors recommending 1 lowly regarded stock. 11 b 18 i G9 9 1 6 10 a 17 h F E 12 c 7 C 3 A L M 2 D K 15 f J B 4 13 d N G 5 14 e C 1 1.1 I g 1.1 H g 1.1 G 5 1.1 G d 1.1 G 9 1.1 G 3 1.1 G 2 1.0 G 4 1.0 D 5 1.0 B 3 1.0 B 2 1.0 D 3 1.0 G f 1.0 A 2 1.0 A 4 1.0 B 1 1.0 D 4 1.0 A 1 1.0 D 1 1.0 14 1 2 3 4 5 6 7 8 9 a b c d e f g h i 1/SAH+sum(y in PH)[(1/SAy)]/|PH| SA 5 5 4 5 3 2 2 1 3 2 2 1 4 4 5 4 1 2 | 1/S0.2 0.2 0.2 0.2 0.3 0.5 0.5 1 0.3 0.5 0.5 1 0.2 0.2 0.2 0.2 1 0.5 V 1/SA SA Ct A 1 1 0 1 0 0 0 0 0 0 0 0 0 0 0 0 0 0 0.45 0.25 4 3 B 1 1 1 0 0 0 0 0 0 0 0 0 0 0 0 0 0 0 0.46 0.25 4 3 C 1 1 1 1 1 1 0 0 0 0 0 0 0 0 0 0 0 0 0.61 0.33 3 6 D 1 0 1 1 1 0 0 0 0 0 0 0 0 0 0 0 0 0 0.44 0.2 5 4 E 1 1 1 1 1 1 1 0 1 0 0 0 0 0 0 0 0 0 0.81 0.5 2 8 F 1 1 1 1 0 1 1 1 0 0 0 0 0 1 0 0 0 0 1.38 1 1 8 G 0 1 1 1 1 0 1 0 1 1 0 0 1 1 1 0 0 0 0.50 0.2 5 10 H 1 1 1 1 0 1 1 1 1 1 1 1 1 0 1 1 0 0 0.67 0.25 4 14 I 1 0 1 0 0 0 0 1 1 1 1 1 1 1 0 1 1 1 0.70 0.2 5 12 J 0 0 0 0 0 0 0 0 0 0 1 1 1 1 1 0 0 0 0.94 0.5 2 5 K 0 0 0 0 0 0 0 0 0 0 0 0 0 1 1 0 1 1 0.98 0.5 2 4 L 0 0 0 0 0 0 0 0 0 1 1 1 1 1 1 0 0 0 0.78 0.33 3 6 M 0 0 0 0 0 0 0 0 0 0 0 1 1 1 0 0 0 0 0.7 0.2 5 3 N 0 0 0 0 0 0 0 0 0 0 0 1 1 1 0 0 0 0 1.5 1 1 3 SAk+sum(X in Pk)[SAX]/|Pk| 0.5 0.5 0.6 0.5 0.6 1.0 0.9 1.4 0.6 0.7 0.8 1.4 0.6 0.7 0.5 0.4 1.3 0.8 Ct 8 7 8 7 4 4 4 3 4 4 4 6 7 8 5 2 2 2
More Complex Graph Structures? HyperGraphs, cliqueTrees (cTrees), Motifs BiPART Clique Mining finds MaxCliques at cost of pairwise &s. Each LETpTreeMCLQ unless pairwise & with same count.A&B, B w Ct(A&B)=Ct(A) is a MCLQ. potential for a k-plex [k-core] mining alg here. Instead of Ct(A&B)=Ct(A), consider. E.g., Ct(A&B)=Ct(A)-1. Each such pTree, C, would be missing just 1vertex (1 edge). Taking any MCLQ as above, ANDing in CpTree would produce a 1-plex. ANDing in k such C’s would produce a k-plex. In fact, suppose we have produced a k-plex in such a manner, then ANDing in any C with Ct(C)=Ct(A)-h would produce a (K+h)-plex. &i=1..nAi is a [i=1..nCt(Ai)]-Core TriPART Clique Mining Algorithm? In a Tripartite Graph edges must start and end in different vertex parts. E.g., PART1=tweeters; PART2=hashtags; PART3=tweets. Tweeters-to-hashtags is many-to-many? Tweeters-to-tweets is many-to-many (incl. retweets)?; hashtags-to-tweets is many-to-many? MultiPART Graphs BiPART, TriPART (have 2,3 PARTs respectively but still an edge is a linear (between two vertices) … No edge can start and end in the same PART. D I S Cts 0 1 1 0 1 1 1 1 0 2 2 2 HyperCliqueMining: A 3hyperGraph has 3 vertex PARTS and each edge is a planar triangle (defined by a vertex triple, one from each PART). Stock recommender is 3hyperGraph (Investors, Stocks, Days). A triangular edge connects Investor k, Stock X, and Day n if k recommends X on day n. A 3hyperClique is a community s.t. all investors in clique recommend all stocks in the clique on each day in clique. Tweet ex: PART1=tweeters; PART2=hashtags; PART3=tweets. Conjecture: KmultiCliques and KhyperCliques are in 1-1 correspondence (both are defined by a K PART vertex set)? So, only one mining process needed? We will represent these common objects with cliqueTrees (cTrees). A cTree bitmaps each PART of the clique. E.g., the cTree for Inv={2,3}; Stock={A,B} Day={,}: GRAPH (linear edges, 2 vertices) kHyperGraph (edges=k vertices) Cliques, Kplexes and Kcores are subgraphs (communities) defined using an internal edge count. A Motif is a subgraph defined using external “isomorphism into the graph” count. A motif must occur (isomorphically) in the graph more times than “expected”. Criticism: Some authors argue[62] that a motif structure does not necessarily determine function. Recent research[64] shows the connections of a motif to the network, is too important to draw function inferences just from local structure.[65] Research shows certain topological features of biological networks naturally give rise to canonical motifs,.[66] kPART HyperGraph (V=!Vii=1..k (x1..xk)E xj,xjsame Vi ) kPARTITE Graph or just kPART Graph (V=!Vii=1..k (x,y)Ex,ysame Vi ) Most find induced Motifs. A graph, G′, is a subgraph of G (G′⊆G) if V′⊆V and E′⊆E∩(V′×V′). If G′⊆G and G′ contains all ‹u,v›∈E with u,v∈V′, G′ is induced sub-graph. G′ and G are isomorphic (G′↔G), if a bijection f:V′→V with ‹u,v›∈E′⇔‹f(u),f(v)›∈E u,v∈V′. G″⊂G and an isomorphism between G″ and G′, G′ appears in G). The number of appearances G′ in G is the frequency FG of G′ in G, FG(G’). G is recurrent or frequent in G, when FG(G’)>threshold (pattern=frequent subgraph). Motif discovery includes exact counting, sampling, pattern growth. Motif discovery has 2 steps: calculate the # of occurrences; evaluating the significance. Are Stock-Inv or Stock-Inv-Day Motifs useful? Some questions/theorems/thoughts: • All K-Paths are isomorphic (thus, there’s alway a Kpath motif). • A ShortestKPath is an Induced subgraph. • What does sequence Frequency(1PathMotif)=|V|, Frequency(2PathMotif),…tell? • Sequence of Frequency(Shortest1Path), Frequency(Shortest2Path), …? • Sequence Frequency(MaxShortest1Path), Frequency(MaxShortest2Path)… tell us? where a MaxS2P is not part of a S3P. • Extend to HyperEdges? What is a path in, e.g., a 3HyperGraph? Both? 2HGInterface3HyperGraphPath. 1HGI3HGP. (In general, hHGIkHGP, where 0<h<k) At the other extreme (all SPs are length=1: • I’ll bet most important motifs, M(V’,E’) in G are “Shortest Path Motifs”: x,yV’, a G-ShortestPath in M running from x to y. I.e., M is made up of G-SPs. • A Clique is a SPMotif (made up entirely of Shortest1Paths) Or? A 4PARThyperGraph or just 4HyperGraph has 4 vertex PARTS and each edge is a solid tetrahedron (defined by a vertex quadruple, one from each PART). Stock Recommender 4hyperGraph (Investors, Stocks, Strengh(StronBuy,…), Days). A tetrahedral hyperedge is a recommendation (connects Investor k, Stock X, Strength B and Day n iff k recommends X as a Buy on day n).A 4hyperClique is a community s.t. all the investors recommend all the stocks as strength=B on each day in the clique. some degeneracy since the Strength will always be singleton? One might argue that this is just a series of 3HyperGraphs, one for each strength level.) A Tweet 4HyperGraph: PART1=tweeters; PART2=hashtags; PART3=tweets, PART4=day. A 4hyperClique: all tweeters send all tweets on all hashtags each day of the clique. A MBR 4HyperGraph: PART1=customers; PART2=items; PART3=days, PART4=store. A 4hyperClique: all customers buy all items at all stores on each day of the clique.
Introduction to 2PART Graph Community Search: For a multipartite graph the concept of community is still related to a large density of edges between members of the same group. A clique in a 2PART (bipartite) graph to be a bipartite subset of vertices with all possible edges. 2PART Induction thm: In a bipartite graph, a Kclique and 3clique that share an edge form a (K+1)clique iff all edges that can exist, from the non-shared Kclique vertices to the non-shared 3clique vertex, do exist. 2PART 3Clique thm: a pair of vertices from part1, a,b and a vertex from the part2, 1, form a 3Clique iff both possible edges a1, b1 exist. CLQ3 is constructed by listing each vertex pair in each pTree along with the naming vertex of the pTree. a a 1 1 b The 2 3cliques ab1 and b12 sharing b1 form a 4clique iff the non-shared vertex pair a2 is an edge The 2 3cliques ab1 and bc1 sharing b1 form a 4clique. b c 2 a 1 b c d a 1 a a b 1 1 b b c 2 2 5clique abc12 and 3clique c23 sharing c2 form a 6clique iff the non-shared vertex pairs a3and b3 are edges. 5clique abc12 and 3clique d12 sharing vertices 1 and 2 form a 6clique. 5clique abcd1 and 3clique de1 sharing edge e1 form a 6clique. c c d 3 d e a a 1 a 1 b a b 1 1 6clique abc123 and 3clique cd3 sharing c3 form a 7clique iff the non-shared vertex pairs d1 and d2 are edges. 6clique abc123 and 3clique d23 sharing vertices 2 and 3 form a 7clique iff vertex pair d1 is an edge. 6clique abcd12 and 3clique de2 sharing edge d2 form a 7clique iff vertex pair e1 is an edge 6clique abcde1 and 3clique ef1 sharing edge e1 form a 7clique. b 2 c b 2 c 2 c d c 3 d 3 d e d e f a 1 b 2 The 4clique ab12 and 3clique bc2 sharing b2 form a 5clique iff the non-shared vertex pair c1 is an edge. The 4clique abc1 and 3clique cd1 sharing c1form a 5clique c Although the pattern seems complex, the 2PART Clique Algorithm can be stated: A Kclique and 3clique sharing 2 vertices form a K+1clique iff all edges from the non-shared 3clique vertex to each non-shared Kclique vertex (from the other PART) exist. That is, check edge existence between all non-shared vertices.
2PART G11: Inv(12345) rec Stock(ABCDE) cliqueTrees NPZpTrst=5 L=2 L=1 L=0 G11 Stock EBCTs I S 1 A 1 1 1 1 1 1 1 2 3 4 5 0 0 0 0 1 0 1 1 1 0 1 3 0 0 1 1 1 0 1 1 1 0 3 3 1 1 0 0 0 1 1 1 1 0 2 4 0 1 0 0 0 1 1 1 1 1 1 5 0 1 1 1 0 0 0 1 1 1 3 3 1 2 3 4 5 1 2 3 4 5 1 2 3 4 5 1 2 3 4 5 1 2 3 4 5 A A A A A B B B B B C C C C C D D D D D E E E E E 1 1 0 1 0 1 1 0 0 0 1 1 1 1 0 1 1 1 1 0 0 1 1 1 0 1 1 0 1 0 1 0 1 1 0 3 3 1 1 1 1 0 0 0 1 1 0 4 2 0 1 0 1 0 1 0 1 1 1 2 4 2 B New DSs: Traditional data structures 3 C EdgeTbl A B C D E Stock EBCTs I S Investor BCTs S I Stock BCTs I S 1 1 1 1 2 2 2 2 2 3 3 3 4 4 4 4 Inv EBGTs 4 D A B C D A B C D E C D E A C D E A B C D E A B C D E 1 2 3 4 5 1 2 3 4 5 1 0 0 0 0 1 1 0 1 0 1 3 1 0 1 1 0 1 1 0 1 0 3 3 1 1 0 0 0 1 1 1 1 0 2 4 1 0 0 0 0 1 1 1 1 0 1 4 0 1 0 0 0 1 1 1 1 1 1 5 1 1 1 1 0 1 1 0 0 0 4 2 0 1 0 0 0 1 1 0 0 0 1 2 0 1 0 0 0 1 1 1 1 1 1 5 0 0 1 1 0 1 1 1 1 0 2 4 0 0 1 0 0 0 0 1 1 1 1 3 0 1 1 1 0 0 0 1 1 1 3 3 0 0 1 0 0 1 1 1 1 0 1 4 0 0 0 1 0 1 0 1 1 1 1 4 0 1 0 1 0 1 0 1 1 1 2 4 0 0 0 1 0 1 1 1 1 0 1 4 0 1 1 1 0 3 1 1 0 1 0 3 1 1 1 1 0 4 1 1 0 0 0 2 1 1 1 1 0 4 5 E oa 0 1 0 1 0 1 1 0 0 0 1 1 1 1 0 Graph G11 oa A B C D E A B C D E 1 2 3 4 5 1 2 3 4 5 1 1 0 0 0 1 1 1 1 0 =C a MaxClique.Then 1 of must be a BC, say Expanding it must give C. Thus, for Tripartite Graphs, every MaxClique is an EBCT =C a MaxClique.Then 1 of must be a BC, say Expanding it gives C. Thus, for Bipartite Graphs, every MaxClique is an EBCT. 1 1 1 1 1 0 2 1 1 1 1 1 3 0 0 1 1 1 4 1 0 1 1 1 5 0 0 0 0 0 0 1 0 0 0 0 1 0 0 0 1 1 1 1 0 0 1 0 0 0 1 0 0 0 0 1 1 1 1 0 1 0 0 0 0 1 1 1 1 0 0 1 0 0 0 1 0 0 0 0 1 1 1 1 0 0 1 0 0 0 1 1 1 1 0 1 0 0 0 0 1 1 1 1 0 A B C D E Adj Matrix 1 1 1 1 1 2 2 2 2 2 3 3 3 3 3 4 4 4 4 4 5 5 5 5 5 A B C D E A B C D E A B C D E A B C D E A B C D E 1 1 1 1 0 1 1 1 1 1 0 0 1 1 1 1 0 1 1 1 0 0 0 0 0 1 0 1 0 1 1 0 0 1 2 2 1 1 1 1 1 0 0 1 0 0 3 1 1 DI StockBaseCliqueTrees D I S 3PART HyperGraph H1: On Days() Investors(123) recommend Stocks(ABC) 1 1 1 2 2 2 3 3 3 1 1 1 2 2 2 3 3 3 1 1 1 2 2 2 3 3 3 A B C A B C A B C A B C A B C A B C A B C A B C A B C 1 0 1 1 1 1 0 0 1 1 0 0 0 1 1 1 1 0 1 0 0 1 1 1 1 0 1 It is not true that 1 must be a BC, since there could be a different expansion for each of those 4, intersecting in C. In that case, we get each of those different expansions as an EBCT, but then the other operator will give us C (we will AND those expansions yielding the core leaf but OR the singletons giving the correct Part of C. DIS NPZ pTree Stride=3 L=2 L=1 L=0 (It’s hard to draw a HyperGraph – will try on next slide) 1 0 0 1 1 0 1 0 1 1 2 2 1 0 0 1 0 0 1 0 1 1 1 2 1 0 0 1 0 0 1 0 1 1 1 2 1 0 0 1 0 0 1 0 1 1 1 2 1 0 0 1 1 0 1 0 1 1 2 2 1 0 0 1 1 0 1 0 1 1 2 2 1 0 0 1 1 0 1 0 1 1 2 2 1 0 1 0 1 0 1 1 1 2 1 3 1 0 0 0 1 0 1 1 1 1 1 3 1 0 0 0 1 0 1 1 1 1 1 3 1 0 1 0 1 0 1 1 1 2 1 3 1 0 1 0 1 0 1 1 1 2 1 3 1 0 1 0 1 0 1 1 1 2 1 3 1 0 0 0 1 0 1 1 1 1 1 3 1 0 1 0 1 1 0 0 1 2 2 1 1 0 0 1 1 1 0 0 1 1 3 1 1 0 0 0 0 1 0 0 1 1 1 1 1 0 0 1 1 1 0 0 1 1 3 1 1 0 0 1 1 1 0 0 1 1 3 1 1 0 1 0 0 1 0 0 1 2 1 1 1 0 0 0 0 1 0 0 1 1 1 1 1 1 1 1 0 0 1 0 0 3 1 1 0 1 0 1 0 0 1 0 0 1 1 1 0 1 1 1 0 1 1 0 0 2 2 1 0 1 1 1 0 1 1 0 0 2 2 1 0 1 0 1 0 1 1 0 0 1 2 1 0 1 0 1 0 0 1 0 0 1 1 1 1 1 1 1 0 0 1 0 0 3 1 1 1 1 1 0 1 0 0 1 1 3 1 2 1 1 1 0 1 0 0 1 1 3 1 2 1 1 1 0 1 0 0 1 1 3 1 2 0 1 0 0 1 0 0 1 1 1 1 2 0 1 0 0 1 0 0 1 1 1 1 2 1 1 1 0 1 0 0 1 1 3 1 2 0 1 0 0 1 0 0 1 1 1 1 2 0 1 0 0 0 1 1 1 0 1 1 2 0 1 0 0 0 1 1 1 0 1 1 2 0 1 0 0 0 1 1 1 0 1 1 2 0 1 0 0 0 1 1 1 0 1 1 2 0 1 0 0 0 1 1 1 0 1 1 2 0 1 0 0 0 1 1 1 0 1 1 2 0 1 0 0 0 1 1 1 0 1 1 2 0 0 1 1 0 0 1 0 0 1 1 1 0 0 1 1 0 0 1 0 0 1 1 1 0 0 1 1 1 1 1 0 0 1 3 1 0 0 1 1 1 1 1 0 0 1 3 1 0 0 1 1 1 1 1 0 0 1 3 1 1 0 1 0 1 0 1 1 1 2 1 3 0 0 1 0 1 0 1 1 1 1 1 3 1 0 1 0 1 0 1 1 1 2 1 3 0 0 1 0 1 0 1 1 1 1 1 3 0 0 1 0 1 0 1 1 1 1 1 3 0 0 1 0 0 1 1 0 1 1 1 2 0 0 1 0 1 1 1 0 1 1 2 2 0 0 1 0 1 1 1 0 1 1 2 2 0 0 1 0 0 1 1 0 1 1 1 2 0 0 1 0 0 1 1 0 1 1 1 2 0 0 1 0 1 1 1 0 1 1 2 2 0 0 1 0 1 1 1 0 1 1 2 2 1 1 1 0 0 0 1 0 1 0 0 0 0 1 1 1 1 0 0 0 0 1 0 0 1 0 0 0 1 1 1 1 0 EdgeMap 1 2 3 1 2 3 DI StockBaseCliqueTrees D I S 1 2 3 1 2 3 1 1 1 1 1 1 1 1 1 A B C A B C A B C A B C 1 0 1 1 1 1 0 0 1 1 0 0 0 1 1 1 1 0 1 0 0 1 1 1 1 0 1 aoa oaa Thm: Every Maximal Clique is an Expanded Base Clique. I.e., C is a Maximal Clique iff C is an Expanded Base Clique I.e., MC(G)=EBC(G). Pf: Let be any MaxClique, C. Then some leaf expansion of each of … is a BCT. After we apply a..aoa..a with o in each but the last position, we will have an EBCT with the upper Parts of C and a leaf that covers the leaf of C. However, the leaf of that EBCT cannot strictly cover the leaf of C lest it be a MaxClique that strictly covers C. Thus, that EBCT=C H1 Stock EBCTs 1 2 3 1 2 3 aoa oaa A B C A B C NPZpTst=5 L=2 L=1 L=0 1 1 1 1 1 0 0 1 0 0 0 1 0 0 0 0 . . . 1 1 1 1 0 0 1 0 0 0 0 1 0 0 0 . . . 1 1 1 1 0 0 0 0 1 0 1 0 0 0 0 . . . 1 1 1 1 0 0 0 0 1 0 0 1 0 0 0 . . . 1 1 1 1 0 0 1 0 1 0 1 1 0 0 0 . . . 1 1 1 1 0 1 0 0 0 0 1 1 0 1 0 0 1 0 0 0 1 1 0 0 1 1 1 1 1 0 4 1 1 1 1 1 5 0 0 1 1 1 3 1 0 1 1 1 4 Proof is suspect because of this example: Even tho is a MaxClique, we don’t get it as a EBCT because neither leaf covers the other. The stmt that is not true is the underlined. 1 2 3 1 1 0 0 0 1 1 0 0 0 A B C
3PART HyperGraph H2: On Days() Investors(12) recommend Stocks(AB) BasecliqueTrees (BcTs), ExpandedBase cTrees (EBcTs)=MaxCliques for: DSI Base cTrees ISD BcTs SDI BcTs SID CBcTs SID CBcTs SDI Base cTrees DSI Base cTrees DSI Base cTrees SID Base cTrees ISD BcTrees SDI Base cTrees DSI Base cTrees SDI Base cTrees DSI Base cTrees DSI Base cTrees ISD BcTrees ISD BcTrees DSI Base cTrees DSI Base cTrees SID Base cTrees SID Base cTrees 1 2 1 2 1 2 1 2 1 2 1 2 0 1 1 0 1 0 1 1 1 1 0 0 1 1 0 1 1 1 1 0 0 1 1 0 1 1 1 1 0 0 1 1 0 1 1 1 1 0 0 1 1 0 1 1 1 1 0 0 1 1 0 1 1 1 1 0 0 1 1 0 1 1 1 1 0 0 1 1 0 1 1 1 1 0 0 1 1 0 1 1 1 1 0 0 1 1 0 1 1 1 1 0 1 1 0 1 1 2 1 1 0 0 1 1 0 1 1 1 1 1 1 0 0 1 2 1 1 1 0 1 1 0 1 1 2 1 1 0 0 1 1 0 1 1 1 1 0 0 1 0 1 1 1 1 1 0 0 1 0 1 1 1 1 1 0 0 1 0 1 1 1 1 1 0 0 1 0 1 1 1 1 0 1 1 0 0 1 0 1 1 0 0 1 1 1 1 0 1 1 0 0 1 1 1 1 0 1 1 0 0 1 1 1 1 0 1 1 0 0 1 1 1 1 0 1 1 0 0 1 1 1 1 0 1 1 0 0 1 1 1 1 0 1 1 0 0 1 1 1 1 0 1 1 0 0 1 1 1 1 A B A B A B A B A B A B A B 1 0 0 1 1 0 1 1 1 1 0 0 1 1 0 1 1 1 1 0 0 1 1 0 1 0 0 1 1 0 1 1 1 0 1 1 0 1 0 1 1 1 0 1 1 0 1 0 1 1 1 0 1 1 0 1 0 1 1 1 0 1 1 0 1 0 1 1 1 0 1 1 0 1 1 1 1 2 0 1 1 0 1 1 1 1 2 0 1 1 0 1 0 1 1 1 0 1 1 0 1 0 1 1 1 0 1 1 0 1 0 1 1 1 0 1 1 0 1 0 1 1 1 0 1 1 0 1 0 1 1 1 0 1 1 0 1 0 1 1 1 0 1 1 0 1 0 1 1 1 1 0 1 0 0 1 1 1 1 1 0 0 1 1 0 1 0 1 0 0 1 1 1 1 1 0 1 0 0 1 1 0 1 0 0 1 1 1 1 1 0 0 1 0 1 0 1 1 0 1 0 0 1 1 0 1 0 1 0 0 1 1 0 1 0 1 0 0 1 0 1 1 0 1 0 1 0 0 1 1 0 1 0 1 0 0 1 0 1 1 0 0 1 0 1 0 1 1 0 1 0 0 1 0 1 0 1 1 0 0 1 0 1 0 1 1 0 1 0 0 1 0 1 1 0 0 1 1 0 1 0 1 0 0 1 0 1 1 0 1 0 1 0 0 1 1 0 1 0 1 0 0 1 0 1 1 0 1 0 1 2 1 2 1 2 A B A B A B A B A B A B A B A B A B A B A B A B A B A B 1 2 1 2 1 2 1 2 1 2 1 2 1 2 1 2 1 2 1 2 1 2 1 2 DIS NPZ pTree Stride=2 L=2 L=1 L=0 aoa oaa oaa aoa oaa aoa aoa aoa aoa aoa 1 1 1 0 1 1 ISD NPZ pTree Stride=2 SDI NPZ pTree Stride=2 IDS NPZ pTree Stride=2 A B 1 2 A B 1 2 0 1 1 0 1 0 1 1 1 1 1 1 DIS BcTs DIS Base cTrees D I S IDS Base cTrees 1 1 0 1 1 1 0 1 0 1 1 0 oaa oaa oaa 1 2 A B 1 2 A B MaxCliques(H2)= 1 BcTs + 1 EBcT 0 1 0 1 1 0 1 1 1 0 0 1 1 0 1 0 0 1 1 1 1 0 2 1 1 1 1 1 1 2 2 2 2 1 1 1 1 2 2 2 2 A A A A B B B B 1 1 2 2 1 1 2 2 A A B B A A B B A A A A B B B B A B A B A B A B A A B B A A B B 1 2 1 2 1 2 1 2 A B A B A B A B 1 1 2 2 1 1 2 2 1 2 1 2 1 2 1 2 0 1 0 0 1 0 1 0 0 1 1 0 0 1 0 0 0 0 1 1 1 0 0 0 0 1 1 0 0 0 1 0 0 1 0 1 1 0 0 0 0 0 1 0 1 1 0 0 1 0 1 0 0 1 1 1 1 1 2 1 2 1 2 1 0 1 0 0 1 1 1 1 1 0 1 0 0 1 1 1 1 1 0 1 0 0 1 1 1 1 1 0 1 0 0 1 1 1 1 1 0 1 0 0 1 1 0 1 0 0 1 1 1 1 1 0 0 1 1 0 1 1 1 1 0 0 1 1 0 1 1 1 1 1 0 1 1 0 2 1 1 0 1 1 0 1 0 0 1 0 1 1 0 0 1 0 1 1 0 1 1 1 0 1 0 1 1 0 1 1 1 0 1 1 1 1 0 1 2 1 0 1 1 0 1 0 1 1 1 0 1 1 1 1 0 1 2 1 0 1 0 1 1 0 1 1 1 1 0 1 0 0 1 1 1 1 A B 1 2 A B 1 2 1 2 1 2 1 2 1 2 1 2 A B A B A B A B A B A B A B A B DSI NPZ pTree Stride=2 aao aao 1 1 The cTreeSet is closed under aao as well and applying aao to DSI and SDI gives the same 2 MaxClique cTrees SDI Base cTrees Seems to be no need to apply the 3 ops to 6 pTreeSets (apply aoa, oaa, aao to any 1 pTreeSet only). And if the 3 ops commute use any order). Can we concatenate pTreeSets into 1 and use only 1 op on it to get all EBcTs? If so, 1 op on 1 pTS gives EBcTs=MCLQs. 0 1 1 0 1 0 0 1 1 1 1 1 2 A B 0 1 1 0 1 0 1 1 1 1 0 1 1 The non-leaf cTree PARTs are a lexico ordering of singletons so construct the EBcTs using only the pTree Leaves? 1 2 Take oaa on one Concatenated BcT (CBcT), generate all EBcTs=MaxCliques! aao SID NPZ pTree Stride=2 1 1 1 1 1 0 0 1 0 1 1 0 oaa oaa
Maximal Base CliqueTrees for H3 Stock Day Investor Base cTrees A B C D E 1 0 0 0 0 1 0 1 1 1 1 1 0 1 0 1 4 3 1 0 0 0 0 0 1 1 0 0 1 1 1 0 0 1 2 3 1 1 1 1 1 0 0 1 0 0 1 1 1 1 0 5 1 4 1 1 1 1 0 1 0 1 1 0 1 1 0 0 0 4 3 2 1 1 1 1 1 0 1 1 0 0 0 1 1 0 0 5 2 2 0 1 0 0 0 0 0 1 0 0 1 1 1 1 1 1 1 5 1 1 1 1 1 0 0 1 1 0 1 1 0 1 0 5 2 3 1 1 0 0 1 0 0 1 1 1 1 0 0 1 0 3 3 2 0 0 1 1 0 1 0 1 0 0 1 1 1 1 0 2 2 4 0 0 1 1 1 1 1 1 0 0 0 1 1 0 0 3 3 2 1 0 1 1 0 1 0 1 1 0 1 1 0 1 0 3 3 3 1 0 1 0 0 1 0 1 1 1 1 1 0 0 0 2 4 2 0 0 1 1 0 1 0 1 0 0 1 1 1 1 0 2 2 4 0 0 0 1 0 1 1 1 1 1 0 1 0 0 0 1 5 1 0 0 1 1 1 1 0 1 0 0 0 1 1 1 0 3 2 3 1 0 0 0 1 0 0 1 1 1 1 1 0 1 0 2 3 3 1 0 0 0 0 1 0 1 1 1 1 1 0 1 0 1 4 3 1 0 0 0 0 0 1 1 0 0 1 1 1 0 0 1 2 3 1 0 0 0 0 0 0 1 0 0 1 1 1 1 0 1 1 4 0 1 0 0 0 1 0 1 1 0 1 1 0 0 0 1 3 2 0 1 0 0 0 0 1 1 0 0 0 1 1 0 0 1 2 2 0 1 0 0 0 0 0 1 0 0 1 1 1 1 1 1 1 5 0 1 0 0 0 0 0 1 1 0 1 1 0 1 0 1 2 3 0 1 0 0 0 0 0 1 1 1 1 0 0 1 0 1 3 2 0 0 1 0 0 1 0 1 0 0 1 1 1 1 0 1 2 4 0 0 1 0 0 1 1 1 0 0 0 1 1 0 0 1 3 2 0 0 1 0 0 1 0 1 1 0 1 1 0 1 0 1 3 3 0 0 1 0 0 1 0 1 1 1 1 1 0 0 0 1 4 2 0 0 0 1 0 1 0 1 0 0 1 1 1 1 0 1 2 4 0 0 0 1 0 1 1 1 0 0 0 1 1 0 0 1 3 2 0 0 0 1 0 1 0 1 1 0 1 1 0 1 0 1 3 3 0 0 0 1 0 1 1 1 1 1 0 1 0 0 0 1 5 1 0 0 0 0 1 1 0 1 0 0 0 1 1 1 0 1 2 3 0 0 0 0 1 1 1 1 0 0 0 1 1 0 0 1 3 2 0 0 0 0 1 0 0 1 0 0 1 1 1 1 0 1 1 4 0 0 0 0 1 0 0 1 1 1 1 1 0 1 0 1 3 3 1 0 0 0 0 1 0 0 0 0 1 1 0 1 0 1 1 3 1 0 0 0 0 0 1 0 0 0 1 1 1 0 0 1 1 3 1 0 0 0 0 0 0 1 0 0 1 1 1 1 0 1 1 4 1 0 0 0 0 0 0 0 1 0 1 1 0 1 0 1 1 3 1 0 0 0 0 0 0 0 0 1 1 1 0 1 0 1 1 3 0 1 0 0 0 1 0 0 0 0 1 1 0 0 0 1 1 2 0 1 0 0 0 0 1 0 0 0 0 1 1 0 0 1 1 2 0 1 0 0 0 0 0 1 0 0 1 1 1 1 1 1 1 5 0 1 0 0 0 0 0 0 1 0 1 1 0 1 0 1 1 3 0 1 0 0 0 0 0 0 0 1 1 0 0 1 0 1 1 2 0 0 1 0 0 1 0 0 0 0 1 1 1 1 0 1 1 4 0 0 1 0 0 0 1 0 0 0 0 1 1 0 0 1 1 2 0 0 1 0 0 0 0 1 0 0 1 1 1 1 0 1 1 4 0 0 1 0 0 0 0 0 1 0 1 1 0 1 0 1 1 3 0 0 1 0 0 0 0 0 0 1 1 1 0 0 0 1 1 2 0 0 0 1 0 1 0 0 0 0 1 1 1 1 0 1 1 4 0 0 0 1 0 0 1 0 0 0 0 1 1 0 0 1 1 2 0 0 0 1 0 0 0 1 0 0 1 1 1 1 0 1 1 4 0 0 0 1 0 0 0 0 1 0 1 1 0 1 0 1 1 3 0 0 0 1 0 0 0 0 0 1 0 1 0 0 0 1 1 1 0 0 0 0 1 1 0 0 0 0 0 1 1 1 0 1 1 3 0 0 0 0 1 0 1 0 0 0 0 1 1 0 0 1 1 2 0 0 0 0 1 0 0 1 0 0 1 1 1 1 0 1 1 4 0 0 0 0 1 0 0 0 1 0 1 1 0 1 0 1 1 3 0 0 0 0 1 0 0 0 0 1 1 1 0 1 0 1 1 3 1 2 3 4 5 CtI oaa (all of these will be Max Cliques) aoa We can count the S=1 D=1 I=4 motifs? 6 + COMBO(5,4)=5 = 11 113? 10+6C(4,3)+C(5,3) = 54 112? 7+10C3,2+6C4,2+C5,2 = 83 A B C D E Day Stock Investor Base cTrees 1 2 3 4 5 CtI 0 0 1 0 0 1 1 1 1 1 1 1 1 1 0 1 5 4 0 0 1 0 0 1 1 1 1 1 1 1 1 1 0 1 5 4 0 0 1 0 0 1 0 0 0 0 1 1 1 1 0 1 1 4 0 0 1 0 0 0 1 0 0 0 1 1 1 1 1 1 1 5 0 0 1 0 0 0 1 0 0 0 1 1 1 1 1 1 1 5 0 0 1 0 0 0 1 0 0 0 1 1 1 1 1 1 1 5 0 0 1 0 0 0 0 1 0 0 1 1 1 1 0 1 1 4 0 0 1 0 0 0 0 0 1 0 1 1 1 1 0 1 1 4 0 0 1 0 0 0 0 0 0 1 1 1 1 1 0 1 1 4 1 0 1 1 0 1 0 1 1 0 1 1 0 1 0 3 3 3 1 0 0 0 0 1 0 0 0 0 1 1 0 1 0 1 1 3 1 0 0 0 0 1 0 1 1 0 1 1 0 1 0 1 3 3 0 1 1 0 0 1 0 0 0 0 1 1 1 0 0 2 1 3 0 1 0 0 0 1 0 0 0 0 1 1 1 0 0 1 1 3 0 1 0 0 0 1 0 0 0 0 1 1 1 0 0 1 1 3 1 0 1 1 0 1 1 1 1 0 1 1 0 0 0 3 4 2 1 0 0 0 0 1 1 1 1 0 1 1 0 0 0 1 4 2 1 0 0 0 0 0 1 0 0 0 1 1 0 0 0 1 1 2 1 0 1 0 0 0 0 1 1 0 1 1 1 1 0 2 2 4 1 0 0 0 0 0 0 1 1 0 1 1 1 1 0 1 2 4 1 0 0 0 0 0 0 1 0 0 1 1 1 1 0 1 1 4 1 0 0 0 0 0 0 0 1 0 1 1 1 1 0 1 1 4 1 0 0 0 0 0 0 0 0 1 0 1 1 1 0 1 1 3 1 0 1 0 0 0 0 1 1 1 0 1 1 1 0 3 3 3 1 0 0 0 0 0 0 1 1 1 0 1 1 1 0 1 3 3 0 1 1 0 0 1 1 1 1 1 0 1 1 0 0 2 5 2 0 1 0 0 0 0 1 0 0 0 0 1 1 0 0 1 1 2 0 1 0 0 0 1 1 1 1 1 0 1 1 0 0 1 5 2 0 1 0 0 0 0 0 1 0 0 0 1 1 0 0 1 1 2 0 1 0 0 0 0 0 0 1 0 0 1 1 0 0 1 1 2 0 1 0 0 0 0 0 0 0 1 0 1 1 0 0 1 1 2 0 0 0 1 0 1 0 0 0 0 1 1 0 1 0 1 1 3 0 0 0 1 0 1 1 1 1 1 1 1 0 1 0 1 5 3 0 0 1 1 0 1 1 1 1 1 1 1 0 1 0 2 5 3 0 0 0 1 0 0 1 0 0 0 1 1 0 1 0 1 1 3 0 0 0 1 0 0 0 1 0 0 1 1 0 1 0 1 1 3 0 0 0 1 0 0 0 0 1 0 1 1 0 1 0 1 1 3 0 0 0 1 0 0 0 0 0 1 1 1 0 1 0 1 1 3 0 0 0 0 1 1 0 0 0 1 1 1 0 1 0 1 2 3 0 0 1 1 1 1 0 0 0 1 1 1 0 1 0 3 2 3 0 0 0 0 1 1 0 0 0 0 1 1 0 1 0 1 1 3 0 0 0 0 1 0 1 0 0 0 1 0 0 1 0 1 1 2 0 0 1 1 1 1 1 0 0 1 1 0 0 1 0 3 3 2 0 0 0 0 1 1 1 0 0 1 1 0 0 1 0 1 3 2 0 0 0 0 1 1 0 1 0 1 1 1 0 0 0 1 3 2 0 0 1 1 1 1 0 1 0 1 1 1 0 0 0 3 3 2 0 0 0 0 1 0 0 1 0 0 1 1 0 0 0 1 1 2 0 1 1 1 1 1 0 1 1 1 0 1 0 0 0 4 4 1 0 0 0 0 1 0 0 0 1 0 0 1 0 0 0 1 1 1 0 0 0 0 1 1 0 1 1 1 0 1 0 0 0 1 4 1 0 0 0 0 1 0 0 0 0 1 1 1 0 1 0 1 1 3 aoa oaa (all of these Max Cliques, only 3 new ones) Stock Investor Day Base cTrees A B C D E 1 0 0 0 0 1 0 0 0 0 1 1 1 1 1 1 1 5 1 0 0 0 0 1 1 0 0 0 1 1 1 1 1 1 2 5 1 0 0 0 0 0 1 0 0 0 1 1 1 1 1 1 1 5 1 0 0 0 0 0 0 1 0 0 0 1 1 0 0 1 1 2 1 0 0 0 0 1 1 1 0 0 0 1 1 0 0 1 3 2 1 0 0 0 0 0 0 0 1 0 1 0 1 1 1 1 1 4 1 0 0 0 0 1 1 0 1 0 1 0 1 1 1 1 3 4 1 0 1 0 0 1 1 0 0 0 1 1 1 1 1 2 2 5 1 0 1 0 0 1 1 1 0 0 0 1 1 0 0 2 3 2 1 0 1 1 0 1 1 0 1 0 1 0 1 1 1 3 3 4 1 0 1 0 0 1 1 0 0 0 1 0 1 1 1 2 2 4 0 1 0 0 0 1 0 0 0 0 1 0 1 1 1 1 1 4 0 1 0 0 0 1 0 0 0 0 1 0 1 1 1 1 1 4 1 1 1 1 0 1 0 0 0 0 1 0 1 1 1 4 1 4 0 1 0 0 0 0 1 0 0 0 1 1 1 1 0 1 1 4 0 1 0 0 0 0 1 0 0 0 1 1 1 1 0 1 1 4 0 1 0 0 0 0 1 1 0 0 0 1 1 0 0 1 2 2 0 1 0 0 0 0 0 1 0 0 0 1 1 0 0 1 1 2 0 1 0 0 0 1 0 0 1 0 0 0 1 1 1 1 2 3 0 1 0 0 0 0 0 0 1 0 0 0 1 1 1 1 1 3 0 1 0 0 0 0 0 0 0 1 0 0 1 0 0 1 1 1 0 1 0 0 0 1 1 1 1 1 0 0 1 0 0 1 5 1 0 0 1 0 0 1 1 0 0 0 1 0 1 1 1 1 2 4 0 0 1 0 0 1 0 0 0 0 1 0 1 1 1 1 1 4 0 0 1 0 0 0 1 0 0 0 1 1 1 1 1 1 1 5 0 0 1 0 0 0 0 1 0 0 1 1 1 0 0 1 1 3 0 0 1 0 0 1 1 1 0 0 1 1 1 0 0 1 3 3 0 0 1 0 0 1 1 0 1 0 1 0 1 1 0 1 3 3 0 0 1 0 0 0 0 0 1 0 1 0 1 1 0 1 1 3 0 0 0 1 0 1 0 0 0 0 1 0 1 1 0 1 1 3 0 0 0 1 0 1 1 0 1 0 1 0 1 1 0 1 3 3 0 0 0 1 0 0 1 0 0 0 1 1 1 1 1 1 1 5 0 0 0 1 0 0 1 0 0 0 1 1 1 1 1 1 1 5 0 0 0 1 0 0 1 1 0 0 1 1 1 0 0 1 2 3 0 0 0 1 0 0 0 1 0 0 1 1 1 0 0 1 1 3 0 0 0 1 0 0 0 0 1 0 1 0 1 1 0 1 1 3 0 0 0 1 0 1 1 0 1 0 1 0 1 1 0 1 3 3 0 0 0 0 1 1 0 0 0 0 0 0 1 1 1 1 1 3 0 0 0 0 1 1 1 0 1 0 0 0 1 1 1 1 3 3 0 0 0 0 1 0 1 0 0 0 1 1 1 1 1 1 1 5 0 0 0 0 1 0 1 0 0 0 1 1 1 1 1 1 1 5 0 0 0 0 1 0 1 1 0 0 1 1 1 0 0 1 2 3 0 0 0 0 1 0 0 1 0 0 1 1 1 0 0 1 1 3 0 0 0 0 1 0 0 0 1 0 1 0 1 1 1 1 1 4 0 0 0 0 1 0 1 0 1 0 1 0 1 1 1 1 2 4 1 1 1 1 1 0 1 0 0 0 1 1 1 1 0 5 1 4 1 1 1 1 1 0 1 1 0 0 0 1 1 0 0 5 2 2 1 1 0 1 1 1 0 0 1 0 0 0 1 1 1 4 2 3 0 1 0 0 0 1 1 1 1 1 0 0 1 0 0 1 5 1 0 0 1 0 0 1 1 1 0 0 1 1 1 0 0 1 3 3 1 0 1 1 1 0 1 0 0 0 1 1 1 1 1 4 1 5 0 0 1 1 1 0 1 1 0 0 1 1 1 0 0 3 2 3 1 0 0 0 1 1 1 0 1 0 0 0 1 1 1 2 3 3 1 0 0 0 1 0 1 0 1 0 1 0 1 1 1 2 2 4 1 2 3 4 5 CtD aoa oaa (all of these Max Cliques, only 3 new ones)
Base CliqueTrees for H3 last 3. Investor Stock Day cTrees 1 2 3 4 5 1 1 0 0 0 1 0 1 0 0 1 1 1 1 1 2 2 5 1 0 0 0 0 1 0 0 0 0 1 1 1 1 1 1 1 5 1 0 0 0 0 1 0 1 0 0 1 1 1 1 1 1 2 5 0 1 0 0 0 1 0 1 1 1 1 1 1 1 1 1 4 5 0 1 0 0 0 1 0 0 0 0 1 1 1 1 1 1 1 5 0 1 0 0 0 1 0 1 1 1 1 1 1 1 1 1 4 5 0 0 1 0 0 1 1 1 1 1 0 1 1 0 0 1 5 2 0 1 1 0 0 1 1 1 1 1 0 1 1 0 0 2 5 2 0 0 1 0 0 1 0 0 0 0 0 1 1 0 0 1 1 2 0 0 0 1 0 1 0 0 0 1 1 0 1 1 1 1 2 4 0 1 0 1 0 1 0 0 0 1 1 0 1 1 1 2 2 4 0 0 0 1 0 1 0 0 0 0 1 0 1 1 1 1 1 4 1 0 0 0 0 1 1 1 0 0 1 0 1 1 1 1 3 4 1 0 0 0 0 1 1 1 0 0 1 0 1 1 1 1 3 4 1 0 0 0 0 0 1 0 0 0 1 0 1 1 1 1 1 4 1 0 0 0 0 0 0 1 0 0 1 0 1 1 1 1 1 5 1 0 0 0 0 1 1 1 1 0 1 0 1 1 1 1 4 4 1 0 0 0 0 1 1 1 1 0 1 0 1 1 1 1 4 4 1 0 0 0 0 0 0 0 1 0 1 0 1 1 0 1 1 3 1 0 0 0 0 1 1 1 0 1 0 0 1 1 1 1 4 3 1 0 0 0 0 1 1 1 0 1 0 0 1 1 1 1 4 3 1 0 0 0 0 0 0 0 0 1 0 0 1 1 1 1 1 3 0 1 0 0 0 0 1 0 0 0 1 1 1 1 0 1 1 4 0 1 0 0 0 1 1 1 1 1 1 1 1 1 0 1 5 4 0 1 0 0 0 1 1 1 1 1 1 1 1 1 0 1 5 4 0 1 0 0 0 0 0 1 0 0 1 1 1 1 1 1 1 5 0 1 0 0 0 0 0 0 1 0 1 1 1 1 1 1 1 5 0 1 0 0 0 0 0 0 0 1 1 1 1 1 1 1 1 5 0 0 1 0 0 0 1 0 0 0 0 1 1 0 0 1 1 2 0 0 1 0 0 0 0 1 1 1 1 1 1 0 0 1 3 3 0 1 1 0 0 0 0 1 1 1 1 1 1 0 0 2 3 3 0 0 1 0 0 0 0 1 0 0 1 1 1 0 0 1 1 3 0 0 1 0 0 0 0 0 1 0 1 1 1 0 0 1 1 3 0 0 1 0 0 0 0 0 0 1 1 1 1 0 0 1 1 3 0 0 0 1 0 0 1 0 0 0 0 0 1 1 0 1 1 2 0 1 0 1 0 1 1 1 1 1 0 0 1 1 0 2 5 2 0 0 0 1 0 1 1 1 1 1 0 0 1 1 0 1 5 2 0 0 0 1 0 1 0 1 1 1 1 0 1 1 0 1 4 3 0 0 0 1 0 0 0 1 0 0 1 0 1 1 0 1 1 3 0 1 0 1 0 1 0 1 1 1 1 0 1 1 0 2 4 3 0 0 0 1 0 0 0 0 1 0 1 0 1 1 0 1 1 3 0 0 0 1 0 0 0 0 0 1 1 0 1 1 1 1 1 4 0 0 0 0 1 0 1 0 0 0 0 0 1 0 0 1 1 1 0 0 0 0 1 0 1 0 0 0 0 0 1 0 0 1 1 1 1 1 1 1 1 0 1 0 0 0 0 0 1 0 0 5 1 1 A B C D E aoa oaa (all of these will be Max Cliques) Day Investor Stock cTrees 1 0 0 0 0 1 0 0 0 0 1 1 1 1 0 1 1 4 1 0 1 1 0 1 1 0 0 0 1 1 1 1 0 3 2 4 1 0 0 0 0 1 1 0 0 0 1 1 1 1 0 1 2 4 1 1 1 1 0 0 1 0 0 0 1 1 1 1 1 4 1 5 1 0 0 0 0 0 1 0 0 0 1 1 1 1 1 1 1 5 1 0 0 0 0 0 1 0 0 0 1 1 1 1 1 1 1 5 1 0 0 0 0 0 1 1 1 0 0 0 1 1 1 1 3 3 1 0 0 0 0 0 0 1 0 0 0 0 1 1 1 1 1 3 1 0 1 0 0 0 1 1 1 0 0 0 1 1 1 2 3 3 1 0 0 0 0 0 1 0 1 0 1 0 1 1 1 1 2 4 1 0 0 0 0 0 0 0 1 0 1 0 1 1 1 1 1 4 1 0 1 1 0 0 1 0 1 0 1 0 1 1 1 3 2 4 0 1 0 0 0 1 0 0 0 0 1 0 0 0 0 1 1 1 0 1 0 0 0 1 1 1 0 0 1 0 0 0 0 1 3 1 0 1 1 0 0 1 1 1 0 0 1 0 0 0 0 2 3 1 0 1 0 0 0 0 1 0 0 0 1 1 1 1 1 1 1 5 0 1 0 0 0 0 1 1 0 0 1 1 1 1 1 1 2 5 0 1 1 0 0 0 1 1 0 0 1 1 1 1 1 2 2 5 0 1 0 0 0 0 0 1 0 0 1 1 1 1 1 1 1 5 0 0 1 0 0 1 1 1 1 0 1 1 1 1 1 1 4 5 0 0 1 0 0 1 1 1 1 0 1 1 1 1 1 1 4 5 0 0 1 0 0 1 0 0 0 0 1 1 1 1 1 1 1 5 0 0 1 0 0 0 1 0 0 0 1 1 1 1 1 1 1 5 0 0 1 0 0 0 0 1 0 0 1 1 1 1 1 1 1 5 0 0 1 0 0 0 0 0 1 0 1 1 1 1 1 1 1 5 0 0 1 0 0 0 0 0 0 1 0 1 0 0 0 1 1 1 0 0 1 0 0 1 1 1 1 1 0 1 0 0 0 1 5 1 0 0 1 0 0 1 1 1 1 1 0 1 0 0 0 1 5 1 0 0 0 0 1 1 0 0 0 0 1 1 1 0 1 1 1 4 0 0 1 1 1 1 0 0 0 0 1 1 1 0 1 3 1 4 0 0 0 0 1 1 0 0 0 0 1 1 1 0 1 1 1 4 0 0 0 0 1 0 1 0 0 0 1 0 1 1 1 1 1 4 1 1 1 1 1 0 1 0 0 0 1 0 1 1 1 5 1 4 0 0 0 0 1 0 1 0 0 0 1 0 1 1 1 1 1 4 0 0 1 1 0 1 1 0 1 0 1 1 1 1 1 2 3 5 0 0 0 1 0 1 0 0 0 0 1 1 1 1 1 1 1 5 0 0 0 1 0 1 1 0 1 0 1 1 1 1 1 1 3 5 0 0 0 1 0 0 1 0 0 0 1 1 1 1 1 1 1 5 0 0 0 1 0 0 0 0 1 0 1 1 1 1 1 1 1 5 0 0 0 0 1 1 0 0 1 0 1 1 0 0 1 1 2 3 0 0 1 1 1 1 0 0 1 0 1 1 0 0 1 3 2 3 0 0 0 0 1 0 0 0 1 0 1 1 0 0 1 1 1 3 1 2 3 4 5 A B C D E oaa (all of these will be Max Cliques) aoa Investor Day Stock cTrees 0 1 0 0 0 0 0 1 0 0 1 1 1 1 1 1 1 5 1 0 0 0 0 1 0 1 1 0 1 1 1 1 0 1 3 4 1 0 0 0 0 1 0 0 0 0 1 1 1 1 0 1 1 4 1 1 0 0 0 1 0 1 1 0 1 1 1 1 0 2 3 4 1 0 0 0 0 0 0 1 1 0 1 1 1 1 1 1 2 5 1 1 0 1 0 0 0 1 1 0 1 1 1 1 1 3 2 5 1 0 0 0 0 0 0 1 0 0 1 1 1 1 1 1 1 5 0 1 0 0 0 1 0 0 0 0 1 1 1 1 1 1 1 5 0 1 0 0 0 1 1 1 1 0 1 1 1 1 1 1 4 5 0 1 0 0 0 1 1 1 1 0 1 1 1 1 1 1 4 5 0 0 0 0 1 0 0 1 0 0 0 1 0 0 0 1 1 1 0 0 0 0 1 0 0 1 0 0 0 1 0 0 0 1 1 1 1 1 1 1 1 0 0 1 0 0 0 1 0 0 0 5 1 1 0 1 0 0 0 1 1 1 1 1 1 0 1 1 1 1 5 4 0 1 0 0 0 1 1 1 1 1 1 0 1 1 1 1 5 4 0 1 0 0 0 0 0 0 0 1 1 0 1 1 1 1 1 4 1 0 0 0 0 0 0 1 1 1 1 1 1 0 1 1 3 4 1 0 0 0 0 0 0 1 1 1 1 1 1 0 1 1 3 4 1 0 0 0 0 0 0 0 0 1 1 1 1 0 1 1 1 4 0 0 0 1 0 0 0 0 1 0 1 1 1 1 1 1 1 5 1 2 3 4 5 0 1 0 0 0 0 0 0 1 0 1 1 1 1 1 1 1 5 1 0 0 0 0 0 0 0 1 0 1 1 1 1 1 1 1 5 0 0 1 0 0 0 1 0 0 0 1 1 1 1 1 1 1 5 0 0 1 0 0 0 1 1 0 0 1 1 1 1 1 1 2 5 0 1 1 0 0 0 1 1 0 0 1 1 1 1 1 2 2 5 0 1 0 0 0 0 1 0 0 0 1 1 1 1 1 1 1 5 0 0 1 0 0 1 0 0 0 0 0 0 1 1 1 1 1 3 0 1 1 0 0 1 1 1 0 0 0 0 1 1 1 2 3 3 0 0 1 0 0 1 1 1 0 0 0 0 1 1 1 1 3 3 1 1 0 0 0 1 1 1 1 1 1 0 0 0 0 2 5 1 1 0 0 0 0 1 1 1 1 1 1 0 0 0 0 1 5 1 1 0 0 0 0 0 1 0 0 0 1 0 0 0 0 1 1 1 0 0 0 1 0 1 0 1 1 0 1 0 1 1 1 1 3 4 0 1 0 1 0 1 0 1 1 0 1 0 1 1 1 2 3 4 0 0 0 1 0 1 0 0 0 0 1 0 1 1 1 1 1 4 1 1 0 1 0 0 0 1 1 0 1 1 1 1 1 3 2 5 0 0 0 1 0 0 0 1 1 0 1 1 1 1 1 1 2 5 0 0 0 1 0 0 0 1 0 0 1 1 1 1 1 1 1 5 0 0 1 0 0 0 0 1 0 0 1 1 1 1 1 1 1 5 1 1 0 1 0 0 0 1 1 1 1 1 0 0 1 3 3 3 0 0 0 1 0 0 0 1 1 1 1 1 0 0 1 1 3 3 0 0 0 1 0 0 0 0 0 1 1 1 0 0 1 1 1 3 A B C D E aoa oaa (all of these will be Max Cliques)
aoa then oaa on the 6 cTrees (removing duplicates - no covers since aoa then oaa gives Maximal Cliques only). We get 34 MCs below. Theorem: These 34 MCs are the only Maxmal Cliques. General thm: {a..ao(a..oa(…oa..a(B)|B=BaseClique} is the MaxCliqueSet. Thus, for a bipartite graph, ao(B) is MCS. Maximal Base CliqueTrees for H3 1 0 0 0 0 1 0 1 1 1 1 1 0 1 0 1 4 3 1 0 0 0 0 0 1 1 0 0 1 1 1 0 0 1 2 3 1 1 1 1 1 0 0 1 0 0 1 1 1 1 0 5 1 4 1 1 1 1 0 1 0 1 1 0 1 1 0 0 0 4 3 2 1 1 1 1 1 0 1 1 0 0 0 1 1 0 0 5 2 2 0 1 0 0 0 0 0 1 0 0 1 1 1 1 1 1 1 5 1 1 1 1 1 0 0 1 1 0 1 1 0 1 0 5 2 3 1 1 0 0 1 0 0 1 1 1 1 0 0 1 0 3 3 2 0 0 1 1 0 1 0 1 0 0 1 1 1 1 0 2 2 4 0 0 1 1 1 1 1 1 0 0 0 1 1 0 0 3 3 2 1 0 1 1 0 1 0 1 1 0 1 1 0 1 0 3 3 3 1 0 1 0 0 1 0 1 1 1 1 1 0 0 0 2 4 2 0 0 1 1 0 1 0 1 0 0 1 1 1 1 0 2 2 4 0 0 0 1 0 1 1 1 1 1 0 1 0 0 0 1 5 1 0 0 1 1 1 1 0 1 0 0 0 1 1 1 0 3 2 3 1 0 0 0 1 0 0 1 1 1 1 1 0 1 0 2 3 3 1 0 0 0 0 1 0 1 1 1 1 1 0 1 0 1 4 3 1 0 0 0 0 0 1 1 0 0 1 1 1 0 0 1 2 3 1 1 1 1 1 0 0 1 0 0 1 1 1 1 0 5 1 4 1 1 1 1 0 1 0 1 1 0 1 1 0 0 0 4 3 2 1 1 1 1 1 0 1 1 0 0 0 1 1 0 0 5 2 2 0 1 0 0 0 0 0 1 0 0 1 1 1 1 1 1 1 5 1 1 1 1 1 0 0 1 1 0 1 1 0 1 0 5 2 3 1 1 0 0 1 0 0 1 1 1 1 0 0 1 0 3 3 2 0 0 1 1 0 1 0 1 0 0 1 1 1 1 0 2 2 4 0 0 1 1 1 1 1 1 0 0 0 1 1 0 0 3 3 2 1 0 1 1 0 1 0 1 1 0 1 1 0 1 0 3 3 3 1 0 1 0 0 1 0 1 1 1 1 1 0 0 0 2 4 2 0 0 1 1 0 1 0 1 0 0 1 1 1 1 0 2 2 4 0 0 0 1 0 1 1 1 1 1 0 1 0 0 0 1 5 1 0 0 1 1 1 1 0 1 0 0 0 1 1 1 0 3 2 3 1 0 0 0 1 0 0 1 1 1 1 1 0 1 0 2 3 3 A B C D E 1 0 1 0 0 1 1 1 1 1 1 1 0 0 0 2 5 2 1 0 1 0 0 0 1 1 0 0 1 1 1 0 0 2 2 3 1 0 1 1 0 1 0 1 1 1 1 1 0 1 0 3 4 3 0 0 1 1 1 1 0 1 0 0 0 1 1 1 0 3 3 3 1 0 1 0 1 0 0 1 1 1 1 1 0 0 0 3 3 2 1 0 1 1 1 0 1 1 1 1 0 1 0 0 0 4 4 1 1 1 1 1 0 1 0 1 1 1 1 0 0 0 0 4 4 1 1 1 1 1 1 1 1 1 1 0 0 1 0 0 0 5 4 1 1 1 0 1 1 0 0 1 1 1 1 0 0 1 0 4 3 2 0 0 1 0 0 1 1 1 0 0 1 1 1 0 0 1 3 3 1 0 1 1 1 1 1 1 1 1 0 1 0 0 0 4 5 1 1 0 0 0 1 1 0 1 1 1 0 1 0 1 0 2 4 2 1 0 1 0 0 1 1 1 1 1 1 1 0 0 0 2 5 2 1 0 1 0 0 0 1 1 0 0 1 1 1 0 0 2 2 3 1 0 1 1 0 1 0 1 1 1 1 1 0 1 0 3 4 3 0 0 1 1 1 1 0 1 0 0 0 1 1 1 0 3 3 3 1 0 1 0 1 0 0 1 1 1 1 1 0 0 0 3 3 2 1 0 1 1 1 0 1 1 1 1 0 1 0 0 0 4 4 1 1 1 1 1 0 1 0 1 1 1 1 0 0 0 0 4 4 1 1 1 1 1 1 1 1 1 1 0 0 1 0 0 0 5 4 1 1 1 0 1 1 0 0 1 1 1 1 0 0 1 0 4 3 2 0 0 1 0 0 1 1 1 0 0 1 1 1 0 0 1 3 3 1 0 1 1 1 1 1 1 1 1 0 1 0 0 0 4 5 1 1 0 0 0 1 1 0 1 1 1 0 1 0 1 0 2 4 2 1 1 1 0 0 1 0 1 1 1 1 0 0 0 0 3 4 1 1 1 1 0 1 0 0 1 1 1 1 0 0 0 0 4 3 1 1 1 1 1 1 0 0 1 1 0 0 1 0 1 0 5 2 2 1 0 1 1 1 1 0 1 1 0 0 1 0 1 0 4 3 2 A B C D E 1 1 0 0 0 1 0 1 0 0 1 1 1 1 1 2 2 5 0 1 0 0 0 1 0 1 1 1 1 1 1 1 1 1 4 5 0 1 1 0 0 1 1 1 1 1 0 1 1 0 0 2 5 2 0 1 0 1 0 1 0 0 0 1 1 0 1 1 1 2 2 4 1 0 0 0 0 1 1 1 0 0 1 0 1 1 1 1 3 4 1 0 0 0 0 1 1 1 1 0 1 0 1 1 1 1 4 4 1 0 0 0 0 1 1 1 0 1 0 0 1 1 1 1 4 3 0 1 0 0 0 1 1 1 1 1 1 1 1 1 0 1 5 4 0 1 1 0 0 0 0 1 1 1 1 1 1 0 0 2 3 3 0 1 0 1 0 1 1 1 1 1 0 0 1 1 0 2 5 2 0 1 0 1 0 1 0 1 1 1 1 0 1 1 0 2 4 3 1 1 1 1 1 0 1 0 0 0 0 0 1 0 0 5 1 1 1 0 0 0 0 1 0 1 1 1 1 1 0 1 0 1 4 3 1 0 0 0 0 0 1 1 0 0 1 1 1 0 0 1 2 3 1 1 1 1 1 0 0 1 0 0 1 1 1 1 0 5 1 4 1 1 1 1 0 1 0 1 1 0 1 1 0 0 0 4 3 2 1 1 1 1 1 0 1 1 0 0 0 1 1 0 0 5 2 2 0 1 0 0 0 0 0 1 0 0 1 1 1 1 1 1 1 5 1 1 1 1 1 0 0 1 1 0 1 1 0 1 0 5 2 3 1 1 0 0 1 0 0 1 1 1 1 0 0 1 0 3 3 2 0 0 1 1 0 1 0 1 0 0 1 1 1 1 0 2 2 4 0 0 1 1 1 1 1 1 0 0 0 1 1 0 0 3 3 2 1 0 1 1 0 1 0 1 1 0 1 1 0 1 0 3 3 3 1 0 1 0 0 1 0 1 1 1 1 1 0 0 0 2 4 2 0 0 1 1 0 1 0 1 0 0 1 1 1 1 0 2 2 4 0 0 0 1 0 1 1 1 1 1 0 1 0 0 0 1 5 1 0 0 1 1 1 1 0 1 0 0 0 1 1 1 0 3 2 3 1 0 0 0 1 0 0 1 1 1 1 1 0 1 0 2 3 3 1 2 3 4 5 1 2 3 4 5 A B C D E 1 0 0 0 0 1 0 1 1 1 1 1 0 1 0 1 4 3 1 0 0 0 0 0 1 1 0 0 1 1 1 0 0 1 2 3 1 1 1 1 1 0 0 1 0 0 1 1 1 1 0 5 1 4 1 1 1 1 0 1 0 1 1 0 1 1 0 0 0 4 3 2 1 1 1 1 1 0 1 1 0 0 0 1 1 0 0 5 2 2 0 1 0 0 0 0 0 1 0 0 1 1 1 1 1 1 1 5 1 1 1 1 1 0 0 1 1 0 1 1 0 1 0 5 2 3 1 1 0 0 1 0 0 1 1 1 1 0 0 1 0 3 3 2 0 0 1 1 0 1 0 1 0 0 1 1 1 1 0 2 2 4 0 0 1 1 1 1 1 1 0 0 0 1 1 0 0 3 3 2 1 0 1 1 0 1 0 1 1 0 1 1 0 1 0 3 3 3 1 0 1 0 0 1 0 1 1 1 1 1 0 0 0 2 4 2 0 0 1 1 0 1 0 1 0 0 1 1 1 1 0 2 2 4 0 0 0 1 0 1 1 1 1 1 0 1 0 0 0 1 5 1 0 0 1 1 1 1 0 1 0 0 0 1 1 1 0 3 2 3 1 0 0 0 1 0 0 1 1 1 1 1 0 1 0 2 3 3 A B C D E 1 0 1 0 0 1 1 1 1 1 1 1 0 0 0 2 5 2 1 0 1 0 0 0 1 1 0 0 1 1 1 0 0 2 2 3 1 0 1 1 0 1 0 1 1 1 1 1 0 1 0 3 4 3 1 2 3 4 5 0 0 1 1 1 1 0 1 0 0 0 1 1 1 0 3 3 3 1 0 1 0 1 0 0 1 1 1 1 1 0 0 0 3 3 2 1 0 1 1 1 0 1 1 1 1 0 1 0 0 0 4 4 1 1 1 1 1 0 1 0 1 1 1 1 0 0 0 0 4 4 1 1 1 1 1 1 1 1 1 1 0 0 1 0 0 0 5 4 1 1 1 0 1 1 0 0 1 1 1 1 0 0 1 0 4 3 2 0 0 1 0 0 1 1 1 0 0 1 1 1 0 0 1 3 3 1 0 1 1 1 1 1 1 1 1 0 1 0 0 0 4 5 1 1 0 0 0 1 1 0 1 1 1 0 1 0 1 0 2 4 2 1 1 1 0 0 1 0 1 1 1 1 0 0 0 0 3 4 1 1 1 1 0 1 0 0 1 1 1 1 0 0 0 0 4 3 1 1 1 1 1 1 0 0 1 1 0 0 1 0 1 0 5 2 2 1 0 1 1 1 1 0 1 1 0 0 1 0 1 0 4 3 2 1 2 3 4 5 A B C D E 1 2 3 4 5 1 0 1 1 0 1 1 0 0 0 1 1 1 1 0 3 2 4 1 1 1 1 0 0 1 0 0 0 1 1 1 1 1 4 1 5 1 0 1 0 0 0 1 1 1 0 0 0 1 1 1 2 3 3 1 0 1 1 0 0 1 0 1 0 1 0 1 1 1 3 2 4 0 1 1 0 0 1 1 1 0 0 1 0 0 0 0 2 3 1 0 1 1 0 0 0 1 1 0 0 1 1 1 1 1 2 2 5 0 0 1 0 0 1 1 1 1 0 1 1 1 1 1 1 4 5 0 0 1 0 0 1 1 1 1 1 0 1 0 0 0 1 5 1 0 0 1 1 1 1 0 0 0 0 1 1 1 0 1 3 1 4 1 1 1 1 1 0 1 0 0 0 1 0 1 1 1 5 1 4 0 0 1 1 0 1 1 0 1 0 1 1 1 1 1 2 3 5 0 0 1 1 1 1 0 0 1 0 1 1 0 0 1 3 2 3 0 0 1 0 0 1 1 1 1 1 1 1 1 1 0 1 5 4 0 0 1 0 0 0 1 0 0 0 1 1 1 1 1 1 1 5 1 0 1 1 0 1 0 1 1 0 1 1 0 1 0 3 3 3 0 1 1 0 0 1 0 0 0 0 1 1 1 0 0 2 1 3 1 0 1 1 0 1 1 1 1 0 1 1 0 0 0 3 4 2 1 0 1 0 0 0 0 1 1 0 1 1 1 1 0 2 2 4 1 0 1 0 0 0 0 1 1 1 0 1 1 1 0 3 3 3 0 1 1 0 0 1 1 1 1 1 0 1 1 0 0 2 5 2 0 0 1 1 0 1 1 1 1 1 1 1 0 1 0 2 5 3 0 0 1 1 1 1 0 0 0 1 1 1 0 1 0 3 2 3 0 0 1 1 1 1 1 0 0 1 1 0 0 1 0 3 3 2 0 0 1 1 1 1 0 1 0 1 1 1 0 0 0 3 3 2 0 1 1 1 1 1 0 1 1 1 0 1 0 0 0 4 4 1 A B C D E 1 2 3 4 5 A B C D E 1 0 0 0 0 1 0 1 1 1 1 1 0 1 0 1 4 3 1 0 0 0 0 0 1 1 0 0 1 1 1 0 0 1 2 3 1 1 1 1 1 0 0 1 0 0 1 1 1 1 0 5 1 4 1 1 1 1 0 1 0 1 1 0 1 1 0 0 0 4 3 2 1 1 1 1 1 0 1 1 0 0 0 1 1 0 0 5 2 2 0 1 0 0 0 0 0 1 0 0 1 1 1 1 1 1 1 5 1 1 1 1 1 0 0 1 1 0 1 1 0 1 0 5 2 3 1 1 0 0 1 0 0 1 1 1 1 0 0 1 0 3 3 2 0 0 1 1 0 1 0 1 0 0 1 1 1 1 0 2 2 4 0 0 1 1 1 1 1 1 0 0 0 1 1 0 0 3 3 2 1 0 1 1 0 1 0 1 1 0 1 1 0 1 0 3 3 3 1 0 1 0 0 1 0 1 1 1 1 1 0 0 0 2 4 2 0 0 1 1 0 1 0 1 0 0 1 1 1 1 0 2 2 4 0 0 0 1 0 1 1 1 1 1 0 1 0 0 0 1 5 1 0 0 1 1 1 1 0 1 0 0 0 1 1 1 0 3 2 3 1 0 0 0 1 0 0 1 1 1 1 1 0 1 0 2 3 3 0 0 1 1 1 1 0 1 0 0 0 1 1 1 0 3 3 3 1 0 1 0 1 0 0 1 1 1 1 1 0 0 0 3 3 2 1 0 1 1 1 0 1 1 1 1 0 1 0 0 0 4 4 1 1 2 3 4 5 A B C D E 1 2 3 4 5 1 2 3 4 5 A B C D E 1 1 0 0 0 1 0 1 1 0 1 1 1 1 0 2 3 4 1 1 0 1 0 0 0 1 1 0 1 1 1 1 1 3 2 5 0 1 0 0 0 1 1 1 1 0 1 1 1 1 1 1 4 5 1 1 1 1 1 0 0 1 0 0 0 1 0 0 0 5 1 1 0 1 0 0 0 1 1 1 1 1 1 0 1 1 1 1 5 4 1 0 0 0 0 0 0 1 1 1 1 1 1 0 1 1 3 4 0 1 1 0 0 0 1 1 0 0 1 1 1 1 1 2 2 5 0 1 1 0 0 1 1 1 0 0 0 0 1 1 1 2 3 3 1 1 0 0 0 1 1 1 1 1 1 0 0 0 0 2 5 1 0 1 0 1 0 1 0 1 1 0 1 0 1 1 1 2 3 4 1 1 0 1 0 0 0 1 1 0 1 1 1 1 1 3 2 5 1 1 0 1 0 0 0 1 1 1 1 1 0 0 1 3 3 3 1 0 1 0 0 1 1 0 0 0 1 1 1 1 1 2 2 5 1 0 1 0 0 1 1 1 0 0 0 1 1 0 0 2 3 2 1 0 1 1 0 1 1 0 1 0 1 0 1 1 1 3 3 4 1 0 1 0 0 1 1 0 0 0 1 0 1 1 1 2 2 4 1 1 1 1 0 1 0 0 0 0 1 0 1 1 1 4 1 4 1 1 1 1 1 0 1 0 0 0 1 1 1 1 0 5 1 4 1 1 1 1 1 0 1 1 0 0 0 1 1 0 0 5 2 2 1 1 0 1 1 1 0 0 1 0 0 0 1 1 1 4 2 3 0 1 0 0 0 1 1 1 1 1 0 0 1 0 0 1 5 1 0 0 1 0 0 1 1 1 0 0 1 1 1 0 0 1 3 3 1 0 1 1 1 0 1 0 0 0 1 1 1 1 1 4 1 5 0 0 1 1 1 0 1 1 0 0 1 1 1 0 0 3 2 3 1 0 0 0 1 1 1 0 1 0 0 0 1 1 1 2 3 3 1 0 0 0 1 0 1 0 1 0 1 0 1 1 1 2 2 4 1 0 0 0 0 1 0 1 1 1 1 1 0 1 0 1 4 3 1 0 0 0 0 0 1 1 0 0 1 1 1 0 0 1 2 3 1 1 1 1 1 0 0 1 0 0 1 1 1 1 0 5 1 4 1 1 1 1 0 1 0 1 1 0 1 1 0 0 0 4 3 2 1 1 1 1 1 0 1 1 0 0 0 1 1 0 0 5 2 2 0 1 0 0 0 0 0 1 0 0 1 1 1 1 1 1 1 5 1 1 1 1 1 0 0 1 1 0 1 1 0 1 0 5 2 3 1 1 0 0 1 0 0 1 1 1 1 0 0 1 0 3 3 2 0 0 1 1 0 1 0 1 0 0 1 1 1 1 0 2 2 4 0 0 1 1 1 1 1 1 0 0 0 1 1 0 0 3 3 2 1 0 1 1 0 1 0 1 1 0 1 1 0 1 0 3 3 3 1 0 1 0 0 1 0 1 1 1 1 1 0 0 0 2 4 2 0 0 1 1 0 1 0 1 0 0 1 1 1 1 0 2 2 4 0 0 0 1 0 1 1 1 1 1 0 1 0 0 0 1 5 1 0 0 1 1 1 1 0 1 0 0 0 1 1 1 0 3 2 3 1 0 0 0 1 0 0 1 1 1 1 1 0 1 0 2 3 3 A B C D E 1 0 1 0 0 1 1 1 1 1 1 1 0 0 0 2 5 2 1 0 1 0 0 0 1 1 0 0 1 1 1 0 0 2 2 3 1 0 1 1 0 1 0 1 1 1 1 1 0 1 0 3 4 3 0 0 1 1 1 1 0 1 0 0 0 1 1 1 0 3 3 3 1 0 1 0 1 0 0 1 1 1 1 1 0 0 0 3 3 2 1 0 1 1 1 0 1 1 1 1 0 1 0 0 0 4 4 1 1 1 1 1 0 1 0 1 1 1 1 0 0 0 0 4 4 1 1 1 1 1 1 1 1 1 1 0 0 1 0 0 0 5 4 1 1 1 0 1 1 0 0 1 1 1 1 0 0 1 0 4 3 2 0 0 1 0 0 1 1 1 0 0 1 1 1 0 0 1 3 3 1 0 1 1 1 1 1 1 1 1 0 1 0 0 0 4 5 1 1 0 0 0 1 1 0 1 1 1 0 1 0 1 0 2 4 2 1 1 1 0 0 1 0 1 1 1 1 0 0 0 0 3 4 1 1 1 1 0 1 0 0 1 1 1 1 0 0 0 0 4 3 1 1 1 1 1 1 0 0 1 1 0 0 1 0 1 0 5 2 2 1 0 1 1 1 1 0 1 1 0 0 1 0 1 0 4 3 2 1 1 0 0 0 1 1 1 1 1 1 0 0 0 0 2 5 1 1 1 0 1 0 0 0 1 1 1 1 1 0 0 1 3 3 3 A B C D E 1 2 3 4 5 1 2 3 4 5