Download
1 / 22
230 likes | 374 Vues
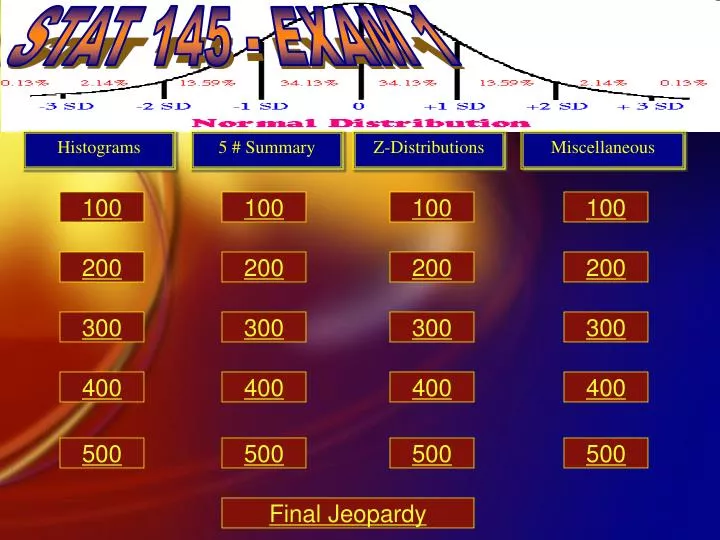
STAT 145 - EXAM 1. 5 # Summary. Z-Distributions. Miscellaneous. 100. 100. 100. 100. 200. 200. 200. 200. 300. 300. 300. 300. Histograms. 400. 400. 400. 400. 500. 500. 500. 500. Final Jeopardy. Histograms - For 100. Total number of employees with less than $10860 in salary.

E N D
STAT 145 - EXAM 1 5 # Summary Z-Distributions Miscellaneous 100 100 100 100 200 200 200 200 300 300 300 300 Histograms 400 400 400 400 500 500 500 500 Final Jeopardy
Histograms - For 100 Total number of employees with less than $10860 in salary What is 94 (46 + 10 + 23 + 15)
Histograms - For 200 Percent of employees with more than $6480 salary and less than $21810 salary What is 46.7% (Employees = 50, Total Number of Employees = 107, 50 divided by 107 = .467 = 46.7%)
Histograms - For 300 The median occurs in this interval What is $4290 & $6480 (Median = (N + 1) / 2 = (107 + 1) / 2 = 54, 54th person occurs between $4290 & $6480)
Histograms - For 400 The third quartile occurs in this interval What is $8670 & $10860 (Median = (107 + 1) / 2 = 54, 53 people to right of median, Q3 = 54 + (53 + 1) / 2 = 81st person, 81st person occurs between $8670 & $10860)
Histograms - For 500 If the outlier on the right is removed (options: increases, decreases, stays the same, indeterminate): • Value of mean • Value of median What is 1) Decreases, 2) Indeterminate
5 # Summary - For 100 This is the five number summary for group 1 (min, Q1, median, Q3, max) What is roughly 58, 77, 87, 108, 140 (answers will vary)
5 # Summary - For 200 • This is the 3rd quartile for group 2 • This group has a larger range • What is roughly 77 (answers will vary) • What is group 1
5 # Summary - For 300 Data set: 20, 17, 40, 39, 23 This is the five number summary for this data set (min, Q1, median, Q3, max) What is 17, 20, 23, 39, 40
5 # Summary - For 400 Data set: 14, 23, 17, 17, 17 This is the SIX number summary for this data set, defined as min, Q1, median, Q3, max, range What is 14, 17, 17, 17, 23, 9
5 # Summary - For 500 Data set: 21, 14, 15, 29, 23, 25 This is the five number summary for this data set (min, Q1, median, Q3, max) What is 14, 15, 22, 25, 29
Z-Distributions - For 100 Using the 68-95-99.7 rule, if the mean scores of people is 60, and the standard deviation of scores is 10, this percent of people scored above 50 What is 84% (50% above 60, 34% between 50 and 60)
Z-Distributions - For 200 If the mean scores of people is 100, and the standard deviation is 10, this percent of people scored less than 90 What is 16% (using 68-95-99.7 rule)
Z-Distributions - For 300 If the mean scores of people is 100, and the standard deviation is 10, this percent of people scored less than 85 What is 6.68% (using Z-Table)
Z-Distributions - For 400 If the mean scores of people is 100, and the standard deviation is 10, this percent of people scored greater than 95 What is 69.15% (using Z-Table)
Z-Distributions - For 500 If the mean scores of people is 114, and the standard deviation is 11, this percent of people scored between 110 and 119 What is 31.42% (P(Z < -.36) = .3594, P(Z < .45) = .6736, P(-.36 < Z < .45) = .3142)
Miscellaneous - For 100 Data Set: Stem & Leaf 5 | 1 1 3 5 9 6 | 7 9 7 | 8 | 1 This is the 3rd Quartile of this stem & leaf plot What is 68
Miscellaneous - For 200 This percent of observations lie between 0.50 & 1.75 What is 62.5%
Miscellaneous - For 300 Standard Normal Distribution Facts (Z-Distributions: Choose the right answer(s) among a, b, c, d): • Always have a mean of 0 and a standard deviation of 1 • The mean is equal to the median • Cannot contain negative values • Cannot contain negative probabilities What is a, b, d (z can be negative, and is negative half of the time)
Miscellaneous - For 400 Data Set: 0, 7, 8, 9 This is the standard deviation of this sample What is 4.0825 (Mean = 6, SS = 36+1+4+9 = 50, std dev = sqrt(50/(4 - 1)) = 4.0825)
Miscellaneous - For 500 The mean score of a population is 100, and the standard deviation of the scores is 15. This percent of people scored between 100 and 120. DAILY DOUBLE!!! (Wager a value between 500 and either your point total so far or 1000, whichever is greater) What is 40.82% (P(Z < 1.33) = .9082)
Final Jeopardy Category: Nasty Z Problem Data Set: 10, 15, 20 Compute mean and standard devation of data set, and assume that this mean and standard deviation represent the population. Now, using the population mean of people’s scores and the standard deviation of these scores, this percentage of scores lie between 17 and 20 What is 18.59% (mean = 15, standard deviation = 5; Z = 1 & Z = .4; P(Z < 1) = .8413, P(Z < .4) = .6554, P(.4 < Z < 1) = .1859)