Download
1 / 46
460 likes | 584 Vues
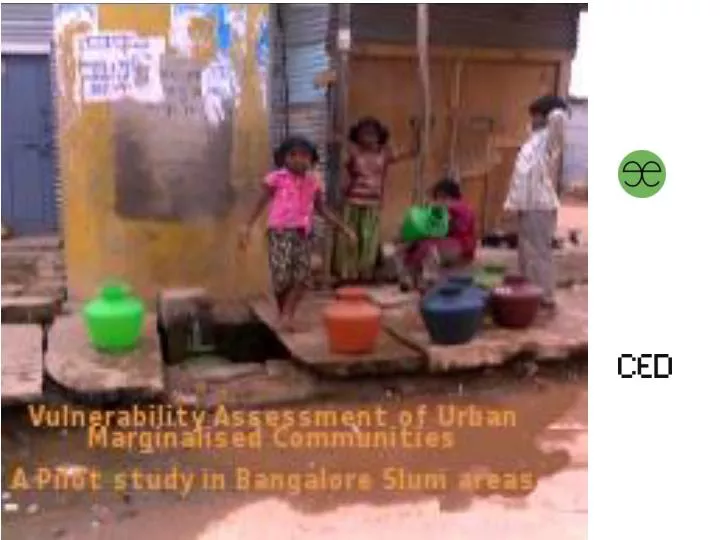
Chair of the Advisory Group : Walter Mendoza Questionnaire and Research Design : Hita Unnikrishnan Researchers : Veena B N, Hita Research Assistance : Jacintha Menezes , Viju & others. Census 2011. In India, 31.2% live in urban centres compared with 27.8% in 2001 and

E N D
Chair of the Advisory Group: Walter Mendoza Questionnaire and Research Design: HitaUnnikrishnan Researchers :Veena B N, Hita Research Assistance: JacinthaMenezes, Viju & others
Census 2011 In India, 31.2% live in urban centres compared with 27.8% in 2001 and 25.5% in 1991. For the 1st time, absolute increase in 10 years in urban areas ( at 91 million) was > in rural areas (at 90.4 million)
Every city is marked by informal settlements where the poor are forced to live without access to basic services like water and sanitation. In some cities like Mumbai, half of the population (49 percent according to Census 2001) lives in slums.
In Bangalore, the number of slum dwellers in a decade has risen from 23% in 2001 to nearly 30-40% of the city's current population. 1/3rd of slums in the city are located in environmentally sensitive and filthy areas. Almost 90% of all slum houses are kutcha and semi pucca shabby dwellings
Further, the Corporation limits have recently been expanded to incorporate fringe areas of the city. 85 such zones with area characteristics of a village have already been considered as slums.
( to answer Bablu’s question.. ) For all these people, any untoward natural event is likely to become a disaster. Thus, Vulnerability is not so much created by Climate Change, but by poor access to land, overcrowding and low-quality housing etc. These need to be fixed.. For any talk of adaptation to be meaningful..
So the Indicators are .. housing structure energy sources • accessibility and consumption of water sanitation facilities solid waste management • health care public and civic amenities Transportation, • educational amenities livelihoods
KS Garden: Old slum in the core of the city vulnerability to climate changes marked by the cramped houses, large number of homes and their proximity to the open drains
EWS Quarters: relocation settlement vulnerability due to institutions kutcha homes - exposure of its residents to climatic extremes s.
ParappanaAgrahara: Fringe habitat recently incorporated into the city’s limits, example of rural to urban transitionthe community’s evolution to a more urban mindset, degradation of natural resources
Some Data • They are only indicative, and should not be taken as percentage, but as instances.. • See it? • `
Perception of Climate Change:No concept of Climate Change.. But understand that weather is changing..
Adaptation: People “adjust” at the dwelling level..
At a larger level, it is is difficult to organize. Thus politics take over
Govt. Policy of putting people in 325 sq ft concrete blocks by PPP – handing over slum lands to developers and giving them more FSI/FAR.Many of these blocks for example even the ones created by a prominent NGO in Mumbai, need people to switch on their light at mid-day. PPP is not working
For communities to act together, • Security of land tenure • Secure relocation, if required • Pre-planning of amenities structures • Clear Policy is required.
Sanitation: • Government/contractor run Community toilet • v/s • Community owned and run toilets. • Options: • Dry toilets, ECOSAN • DEWATS..
For Small Group owned or Individual owned system, there is no space for structure, piping, gravity flow.. Therefore land needs to be set aside. Therefore a pro-slum Development Plan.
Water: Borewell or Piped water or both?Main issue is maintenance & cleanlinessDestruction of common water places like open wells, lakes, ponds. Sometimes privatized by tanker owners. :
In fact policy should be pro-water spaces • improve drains as places of recreation: • Design for animal use, and washing/bathing • Link design to parks , urban agriculture
Solid Waste Policies Waste to Electricity model ? dubious.Centralised Waste dumps/treatment- dubious. Alternatives:New ARTI model for micro- biogas.Source separationDecentralised waste treatment: Community Groups; ALMs
Health: Equip people to better take care of themselves They will do Self care so we may as well educate on proper use &. tipping signs.. TINA : Free Primary Health Care.. Disciplining Chemists