Download
1 / 23
230 likes | 346 Vues
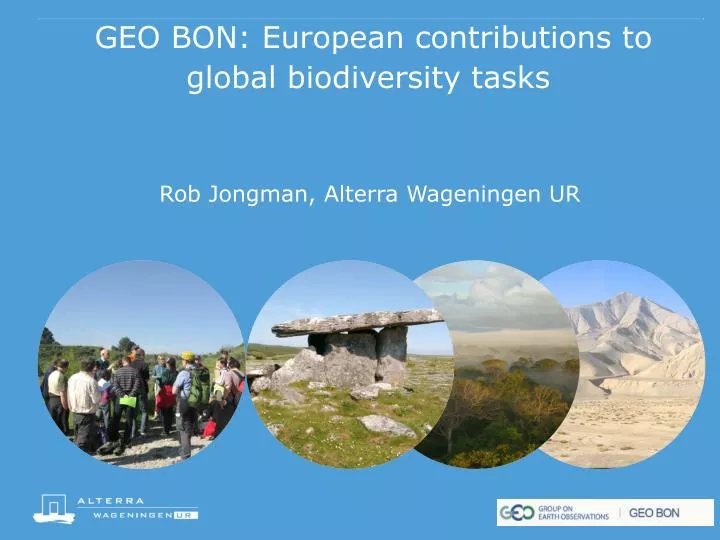
GEO BON: European contributions to global biodiversity tasks. Rob Jongman, Alterra Wageningen UR. What does GEO BON aim for?. GEO BON adds value to on-going biodiversity observation by:

E N D
GEO BON: European contributionstoglobalbiodiversitytasks Rob Jongman, Alterra Wageningen UR
What does GEO BON aim for? GEO BON adds value to on-going biodiversity observation by: • Providing a global, scientifically robust framework for observations on the detection of biodiversity change • Coordinating the data gathering and the delivery of information through establishing standards and interoperability • Providing a set of innovative and relevant global products • Advocating long term continuity of data supply (moving observations from the experimental to operational spheres) and data sharing
Clientsfor GEO BON: Global conventions, (CBD, CMS, Ramsar), EU, countries • The CBD has defined 20 ‘Aichi’ targets structured around 5 major strategic goals including underlying drivers of change, direct pressures, (change in) state, benefits, and responses • Countries have to monitor progress (status and trends) towards CBD targets (and art 17, Habitats Dir) • Many countries are starting up or revising their biodiversity observation programs • Countries and organizations often need guidance for setting up biodiversity observation programs • For international comparison biodiversity data the scientific community and data users need to agree on what variables should be monitored
Gaps in biodiversity status monitoring Living Planet Index Populations Pereira et al 2012. Annual Review of the Environment and Resources.
What is donetodevelop information • GEO BON initiatives to enhance global biodiversity observations for monitoring progress towards the Aichi Biodiversity Targets (through e.g. FP7, GEF, NASA, GIO, Horizon 2020 and other sources) • Development of Essential Biodiversity Variables • Finished and ongoing FP7 projects, such as: • EBONE (European Monitoring Network) • BIO SOS, MS MONINA (GMES services for Biodiversity) • EU BON (integration of biodiversity information systems)
The need for Essential Biodiversity Variables (EBVs) • Can the observations needed to derive the >100 indicators be organized into a relatively small number of Essential Biodiversity Variables? • Where each essential variable talks to multiple indicators and targets and indicators and targets are informed by multiple essential variables • These variables should be consistently monitored and reported at the national scale by the parties, and contribute towards assessing both national targets and global targets
The questionsEBVs must help toanswer: • What is the magnitude of extinctionandbiodiversity change in time andspace? • How does biodiversityrespondto the change in the major drivers (land use change, climate change, etc.)? • What are the consequences of changes in biodiversityforhumans, and are there levels of change beyondwhich the consequencesabruptlyincrease? • Are the collective actions we take toprotectandrestorebiodiversityeffective? Pereira et al 2013 EssentialBiodiversity Variables Science339: 277-278
Scenarios for biodiversity & ecosystem services (e.g. IPBES) High-level indicators of biodiversity & ecosystem services (e.g. CBD) projections projections Ancillary (slow changing) attributes & relationships Ecosystem-service valuation & related observations Observations of drivers & pressures Observations of policy & management responses Essential Biodiversity Variables Genetic composition Community composition Species ranges & populations Ecosystem extent & structure processing Ecosystem function & processes Species traits Primary observations of change in state of biodiversity In-situ monitoring Remote sensing
Global stratification scheme (1km2 grid) • Based on Temp., Prec. and seasonality • Area-weighted aggregation of squares • Permits gap identification and filling • Consistent with the GEO global ecosystem task Metzger et al, 2013, A high resolution bioclimate map of the world: a unifying framework for global biodiversity research. Global Ecology and Biogeography,DOI: 10.1111/geb.12022
Linking regions (1) J4 (cool temperate and moist) Links Bretagne, Cornwall and western Ireland G8 (cold mesic) Links Apennines with other Mountains regions L6 (warm temperate and xeric) Links the hottest parts of Europe with Africa
R9 (extremely hot and moist) Links Australian tropics to SE Asia and beyond P2 (extremely hot and arid) Links the Gibson with the deserts of Arabia, the Sahel and the Thar desert. K10 (warm temperate and mesic) Links Mediterranean regions in Australia with those in Chile, South Africa, California and Europe. Linkingregions (2)
Life form based terrestrial ecosystem classification Link of in-situ data with remotely sensed data, GMES and LCCS Allows conversion between national systems Links with species data General Habitat Categories (GHC) Bunce et al 2008, Landscape Ecology; Tomaselli et al 2013, Landscape ecology; Kosmidou et al, Ecological Indicators, submitted; http://www.ebone.wur.nl
In situ Habitat mapping in Austria Downloadablefrom: http://ebone.wur.nl
Calculating European level indicators Average Habitat Richness Density per country and per EnZ for three levels of precision of habitat typology. Level 1 is related to the diversity of all sampled categories of habitats and a high value indicates a diverse landscape in habitat and management type. The levels 2 and 3 are related to structural variability of habitat types Roche and Geijzendorffer 2013, Integrated figures of Habitat and biodiversity indicators Alterra report 2392
EBONE: Sampling strategy and design • 1 km square, 400 m2 MME • The power of appropriate stratification and location • Structure and Costs of a European sampling design The EBONE sampling design is effective and efficient for relatively common/widespread habitat. For many Annex I habitat types tailor made monitoring designs remain necessary. Precision and power calculations are important but not more than the institutional, data management and other factors.
The Swedish Sampling design (NILS) De Blust et al 2013, Design of a monitoring system and its cost effectiveness Alterra report 2393, Stahl et al 2011, Env Monitoring and Assessment
Remote sensing space and airborne • LiDARfor ecosystem (life form) structure • Phenology and spectral features for function (biomass) • Connectivity and fragmentation measures • Further RS service development is done within on-going projects MS.Monina and BIO SOS Estreguil et al 2012, Habitat landscape pattern and connectivity indices, Alterra report 2297 Clerici et al 2012, Phenology and related measures and indicators at varying spatial scales, Alterra report 2259
Sharing knowledge with others: VitalSigns project • What: combined monitoring of agriculture and biodiversity using RS (LCCS), field data on habitat (GHC) and species and panel interviews; • Where: bread basket areas of sub-Saharan Africa; • Who: CSIR, CI, Columbia University and local groups; • Funding: Bill and Melinda Gates Foundation See http://vitalsigns.org/
What is on-going at present in GEO BON? • GEO BON is developing global cooperation (from 2008 on) • Servicing the CBD by assessment of the Aichi targets (Wageningen workshop 2011); • At present development of the Essential Biodiversity Variables (Wageningen workshop 2011 and Frascatiworkshop 2012 and ongoing) • Work programme renewal (All hands meeting Asilomar (CA) 2012); • Development of the GEO BON Handbook (on-going tobe finished this year)
Take home messages for GEO work • Be aware of the need and trend outside of Europe; • Make your results compatible with the things others do; • Build your network globally and be involved: include partners and related projects outside Europe if possible; • If possible, use open source software for sharing with others, especially in developing countries; • If possible, publish free downloadable reports and papers; • Show and share your models and approaches; • Your result should include capacity building issues if you want a global and long lasting impact.
Thank you for your attention http://www.earthobservations.org/geobon.shtml