Download
1 / 70
740 likes | 1.19k Vues
Power and Sample Size. (Images taken from van Belle). Review of Type I & Type II Errors. When we conduct a test of any hypothesis regardless of the test used we make one of two possible decisions: Reject the null (H o ) in favor of the alternative (H a ) OR

E N D
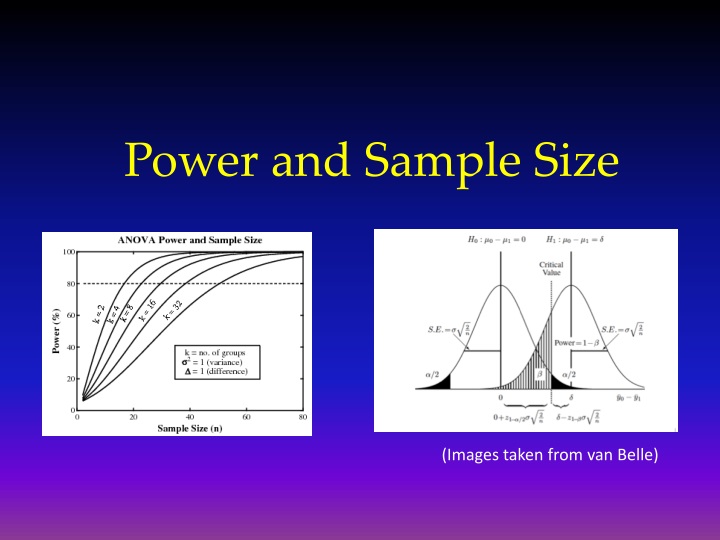
Power and Sample Size (Images taken from van Belle)
Review of Type I & Type II Errors When we conduct a test of any hypothesis regardless of the test used we make one of two possible decisions: Reject the null (Ho) in favor of the alternative (Ha) OR Fail to reject the null hypothesis (Ho) Notice we do NOT say “Accept the null (Ho)
Review of Type I & Type II Errors Because we are making two possible decisions in the presence of uncertainty we can make two possible errors:
Review of Type I & Type II Errors • We choose P(Type I Error) = aTypically a = .05 or .01 or .10 • However we do NOT directly chooseb = P(Type II Error) b a
Review of Type I & Type II Errors We can decrease b by “doing” any of the following: • Increasing the sample size(s) • Increasing a • Choose the “most powerful” test procedure that is appropriate for our analysis. • Decreasing variation no direct control
Power (1 – b) Power = P(Reject Ho|Ha true) = 1 – b Thus the same approaches for decreasing (b) also increase the power. As sample size is the most direct way to decrease (b) – same is true for the POWER.
Power (1 – b) Power also increases the further the true parameter value(s) is away from the hypothesized value under the null. To determine the sample size necessary to achieve a specified power we need specify the following: • Desired minimal power (1 – b) • The size of the difference from the null we wish to detect with this power. (Clinical) • A “guesstimate” for the variation of the population(s) involved. • For independent samples – equal or unequal sample sizes?
Example: Testing Cholesterol Levels For males between the ages of 20-24 the mean cholesterol level is 180 mg/dl with a standard deviation s = 46 mg/dl. Suppose we are interested in determining if the mean cholesterol level for a special diet group of this population is greater than 180 mg/dl. • = mean cholesterol of special diet group mg/dl mg/dl
Example: Testing Cholesterol Levels Suppose that the alternative is true and specifically the mean of this special diet group is 200 mg/dl. If we use a sample size of n = 16 what would be the power of our test? That is, what is the chance that we would obtain a sample mean that would lead to the rejection of the null hypothesis?
Example: Testing Cholesterol Levels We will reject the null hypothesis if the observed sample mean is greater than 198.92 mg/dl. How was this value determined? a = .05 198.92
Example: Testing Cholesterol Levels To find the power when m = 200 mg/dl, we need to find the probability that would obtain a sample mean larger than 198.92 mg/dl. 198.92 200 0.463 Note: NOT DRAWN TO SCALE!! Thus the Power = (1 – b) = 1 - .463 = .537 or 53.7% chance!
Example: Testing Cholesterol Levels Given that, Power = P(Reject Ho|m= 200 mg/dl) = .537 Why is it incorrect to say “Accept Ho”? Because there is only 53.7% we would reject when we should, in other words even when the alternative is actually true we still have a 46.3% chance to NOT reject the null hypothesis! So failure to reject does not necessarily imply that the null hypothesis (Ho) is true!
Example: Testing Cholesterol Levels As stated earlier we can increase the power by - raising a, decreasing s, increasing the difference between the mean under the null and the mean making the alternative true, or increasing sample size. We could plot this relationship to between power and sample size (n) and use this plot to determine sample size needed to achieve a power of say 80% or 90%.
Example: Testing Cholesterol Levels We could plot this relationship between power and sample size (n) and use this plot to determine the sample size needed to achieve a power of say, 80% or 90%. Power = 80%, Power = 90%,
Example: Testing Cholesterol Levels • There are general formulas for determining sample sizes necessary to achieve a desired power for many different test procedures. These formula require specification of: • significance level of the test (a) • information about the variation in the population (e.g. s) • size of the difference to detect (e.g. 200 – 180 = 20 mg/dl) • desired power (by specifying b) • quantiles from a standard normal distribution (Za & Zb ) • I will not derive the formulae for the different testing situations, but will show they are used. Also realize JMP has many of these built-in and allow for doing various calculations pertaining to sample size, power, and difference to detect. You can also find very nice web-apps to do this!
Power and Sample Size: Single population mean (m) For one-tailed testing The sample size necessary to achieve a specified power (1 – b) given the required inputs is: and for two-tailed testing,
Power and Sample Size: Single population mean (m) one-sided The relationships between formula inputs • dec./inc. ninc./dec. • b dec./inc. n inc./dec. • s inc./dec. n inc./dec. • a dec./inc. ninc./dec. One problem with all sample size formulae is they require information about variation that is unknown apriori, i.e. at the start of the study. So we need to “guesstimate” this information.
Power and Sample Size: Single population mean (m) For this hypothetical cholesterol study we need to have a “guesstimate” for the population standard deviation (s). Estimation Strategies: • Use results from similar research in the literature, at least with the same response. (Best approach!) • Use a small pilot study to obtain a sample standard deviation(s) which estimates (s). • Estimated Range/(4 or 6) – guess what the observed range would likely be and divide by 4 or 6. (Sketchy) • Pick a “worst” case value for s, if this value is too large then n will be too large as result, but power goals will be achieved. (Upper bound)
Example: Testing Cholesterol Levels For males between the ages of 20-24 the mean cholesterol level is 180 mg/dl with a standard deviation s = 46 mg/dl. Suppose we are interested in determining if the mean cholesterol level for a special diet group of this population is greater than 180 mg/dl. • = mean cholesterol of special diet group mg/dl mg/dl
Example: Testing Cholesterol Levels Suppose we want to have power of 90% with an for testing these hypotheses and we consider 20 mg/dl above 180 mg/dl to clinically important (i.e. 200 mg/dl or more). What sample size do we need? • = mean cholesterol of special diet group mg/dl mg/dl
Example: Testing Cholesterol Levels one-sided • Assuming we have… • and • Thus Round up
Example: Testing Cholesterol Levels In JMP you can use the Sample Size and Power calculator located in the DOE (Design of Experiments) pull-down menu. You can see there are several testing situations where you can do Power and Sample Size calculations when designing an experiment. We will cover those highlighted in this lecture, as well as others.
Example: Testing Cholesterol Levels In this example we are working with a single population mean, thus we would select the One Sample Mean option. Here the input values are: Difference to detect () Power
Example: Testing Cholesterol Levels After inputting the values leaving the sample size field blank and clicking Continue we find a sample size of n = 58. n = 58 will achieve our power goals (two-sided) To obtain a one-sided a=.05 test we actually have to input a = .10, because JMP does two-sided calculations. This gives a sample size n = 47.
For other testing scenarios – same idea • Testing a single population proportion (p) • Comparing two population means with independent samples • Comparing two population proportions with independent samples • Comparing two population means with dependent samples. • Comparing two population proportions with dependent samples.
Power and Sample Size: Single population proportion (p) For one-tailed testing The sample size necessary to achieve a specified power (1 – b) given the required inputs is: and for two-tailed testing,
Example 2: Testing Smoking Rate Consider the planning of a survey to find out how smoking behavior changed while students were in college. A comprehensive survey four years ago found that 30% of freshmen smoked. The investigator wants to know how many seniors to be sampled. He wants to perform a two-tailed test at the a = .05 level. p = proportion of seniors who smoke (smoking rate same as freshman rate) (smoking rate is different from freshman rate)
Example 2: Testing Smoking Rate Suppose further that the researcher wants to have a 90% of detecting a 5% change in the smoking rate. What sample size should the researcher use? Here… is maximized when p = .50.
Example 2: Testing Smoking Rate What sample size should the researcher use? seniors If we had used rather than we would have obtained To be safe use which gives larger variance!
Example 2: Testing Smoking Rate The inputs for the sample size calculation are: and Power JMP returns the sample size n = 903
Power and Sample Size: independent samples means - equal variances For testing, Assuming equal sample sizes (i.e. & equal population variances (i.e. ). For two-sided tests use instead of .
Power and Sample Size: independent samples means - equal variances Assuming unequal sample sizes, i.e. For example if then we are assuming we want the sample size from population 1 twice as large as the sample size from population 2. For two-sided tests use instead of .
Power and Sample Size: independent samples means - equal variances Again we need to have a “guesstimate” for the population standard deviation (s) common to both populations. Estimation Strategies: • Use results from similar research in the literature, at least with the same response. (Best approach!) • Use a small pilot study to obtain a sample standard deviation(s) which estimates (s). • Estimated Range/(4 or 6) – guess what the observed range would likely be and divide by 4 or 6. (Sketchy) • Pick a “worst” case value for s, if this value is too large then n will be too large as result, but power goals will be achieved. (Upper bound)
Power and Sample Size: independent samples means - unequal variances For testing, Assuming equal sample sizes (i.e. & unequal population variances (i.e. ). For two-sided tests use instead of .
Power and Sample Size: independent samples means - unequal variances Assuming unequal sample sizes, i.e. For example if then we are assuming we want the sample size from population 1 twice as large as the sample size from population 2. For two-sided tests use instead of .
Example: BP of OC and non-OC Users Amongst the women between the ages of 35-39 years of age, suppose we wish to compare the mean systolic blood pressure of nonpregnant, premenopausal oral contraceptive (OC) users to nonpregnant, premenopausal non-OC users. Let, then, (two-sided alternative)
Example: BP of OC and non-OC Users (two-sided alternative) Suppose researchers would like to have a power of 80% to detect a difference of 5 mmHg between these two population means at the level. Also as they anticipate it will be much easier to find non-OC users in this age group, they have decided to sample twice as many non-OC users as OC-users in conducting this study. What samples sizes () and () do should they use?
Example: BP of OC and non-OC Users A small pilot study is conducted where a sample of 21 nonpregnant, premenopausal non-OC users and a sample of 8 nonpregnant, premenopausal, OC-users between the ages of 35-39 is taken. The following results from this pilot study were obtained:
Example: BP of OC and non-OC Users Assuming unequal variances and that we want, we will use the following formulae to determine the sample sizes: Here we have,
Example: BP of OC and non-OC Users Here we have, Plugging in this information we have, non-OC users OC users
Example: BP of OC and non-OC Users Assuming equal variances and equal sample sizesHere we have, Hence we would use equal samples sizes of 193. Assuming equal variances we can compute pooled estimate of From problem set-up on previous slides
Example: BP of OC and non-OC Users The inputs for the sample size calculation from the previous slide: Difference to detect () = 5 Power JMP returns a COMBINED sample size of 2n = 388, in other words 194 subjects per group for a two-sided test. For a one-sided test we would change
Power and Sample Size: Independent samples proportions ( For testing, Assuming values for & , giving a difference to detect and wishing to conduct a size test with power using equal sample sizes the sample size for each group is given by: with and using for two-sided alternative.
Power and Sample Size: Independent samples proportions ( For unequal sample sizes where then the formula for is given by, with
Example: Vitamin E and Breast Cancer The breast cancer rate in women between the ages 45 – 49 is 150 cases per 100,000 amongst currently disease free individuals. We wish to conduct a study to determine if ingesting large doses of vitamin E in capsule form will prevent breast cancer. The study will be set up with a control group (placebo) and a treatment group taking a vitamin E supplement. Researcher expect a 20% reduction in risk for those taking the vitamin E supplement.
Example: Vitamin E and Breast Cancer How large should the equal sample sizes be if a two-sided test with a significance level of is used and a power of 80% is desired? the breast cancer rate for control group the breast cancer rate for vitamin E group
Example: Vitamin E and Breast Cancer Plugging in these quantities we have, or about 235,000 women per group!!
Example: Vitamin E and Breast Cancer The inputs for this example into the sample size calculator for Two Proportions are: Power JMP returns equal sample sizes for each group = 235,100.
Power and Sample Size: Dependent samples means For testing, Assuming the variance for the paired differences or the change in the response is . For two-sided tests use instead of .