Download
1 / 34
340 likes | 424 Vues
How Rising Inequality Stimulates Energy Demand. Robert H. Frank St. Gallen Symposium June 2, 2007. Which world would you choose?. World A: You and your family live in a 4000-square foot house, others live in 6000-square-foot houses.

E N D
How Rising Inequality Stimulates Energy Demand Robert H. Frank St. Gallen Symposium June 2, 2007
Which world would you choose? World A: You and your family live in a 4000-square foot house, others live in 6000-square-foot houses. World B: You and your family live in a 3000-square foot house, others live in 2000-square-foot houses.
Which world would you choose? C: You have 2 weeks of vacation each year, others have 1 week, or D: You have four weeks of vacation each year, others have 6 weeks?
Housing = positional good Leisure = nonpositional good
People care about relative consumption, more in some domains than in others. • 2. Such concerns lead to expenditure arms races focused on positional goods--those goods for which relative position matters most. • 3. Positional consumption is more energy intensive, on average. • 4. Inequality stimulates positional consumption and energy use.
Adam Smith’s invisible hand: Self-interested demands will result in a socially efficient allocation.
Charles Darwin: Traits are selected because of their impact on the reproductive fitness of individuals, not groups. Traits that benefit individuals often work to the disadvantage of groups.
Why do male elephant seals weigh five times as much as females?
The exception that “proves” the rule: Very little sexual dimorphism in monogamous species like the albatross.
Gaining access to mates = a positional good Minimizing the risk of death from predators = a nonpositional good
The Conflict Between Individual and Group Robert H. Frank.“The Demand for Unobservable and Other Nonpositional Goods.” American Economic Review, 75, March, 1985, pp. 101-116.
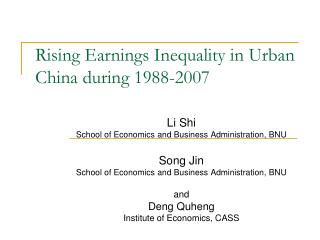
Changes in the Before-Tax Distribution of Income 1949-1979. 1979-1999
Fractal earnings change pattern for virtually every labor market group: Bottom quintile: Absolute earnings decline Middle quintile: Negligible earnings growth Top quintile: Substantial growth
College graduates Dentists The top 1 percent The top 1/10th of 1 percent…
Earnings of CEOs of largest U.S. corporations 1980: 42 x average worker’s earnings 2000: 531 x average worker’s earnings Hedge fund manager James Simons: $1.7 billion in 2006 (38,000 x average worker’s salary) Top 25 hedge fund managers: $14 billion in 2006
A memorable meal An effective interview suit A suitable gift
In a poor country, a man proves to his wife that he loves her by giving her a rose. In a rich country he must give a dozen roses. Richard Layard
If you were society’s median earner, which option would you prefer? • You save enough to support a comfortable standard of living in retirement, but your children attend a school whose students score in the 20th percentile on standardized tests in reading and math; or 2) you save too little to support a comfortable standard of living in retirement, but your children attend a school whose students score in the 50th percentile on those tests?
The cost of sending a child to a school of average quality is linked to the price of the average house in the community. Median size of a newly constructed house: 1980: less than 1600 square feet 2004: more than 2100 square feet
Expenditure Cascades • Top earners spend more because they have more money. • This shifts frame of reference for those just below them, who also spend more. • That, in turn, shifts the frame of reference for those next below. • And so on all the way down the income ladder.
How heavy should your car be? Honda Civic: 2449 pounds Ford Excursion: 7648 pounds
The Progressive Consumption Tax Consumption + Savings = Income Consumption = Income – Savings Taxable consumption = Income – Savings – standard deduction
Gas Grills Then and Now 1989 Sunbeam, $90 Viking Professional, $5,000.