Download
1 / 13
130 likes | 283 Vues
Measuring Ice L oss of Iceland’s Mýrdalsjökull Glacier. Joseph Blake and Laura Biersach. Mýrdalsjökull , 63 ° 40’ N., 19° 06’ W. It is the southern most glacier in Iceland 4,898 ft tall, 260 sq miles Sits on Kalta , a large active volcano

E N D
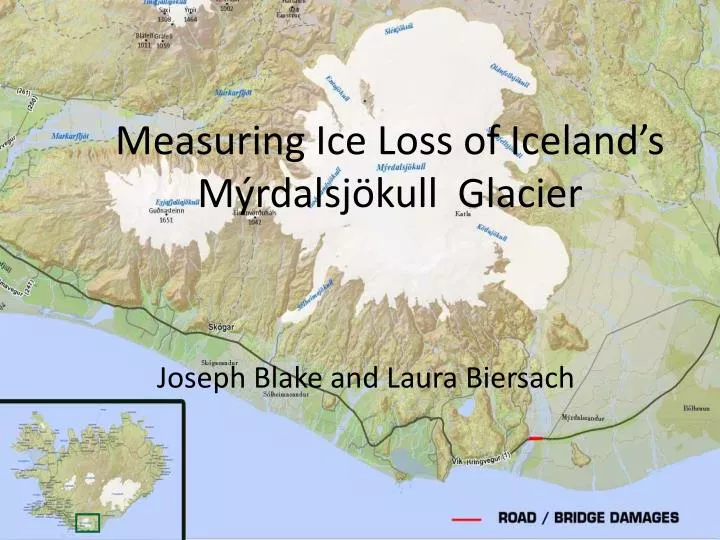
Measuring Ice Loss of Iceland’s Mýrdalsjökull Glacier Joseph Blake and Laura Biersach
Mýrdalsjökull, • 63° 40’ N., 19° 06’ W. • It is the southern most glacier in Iceland • 4,898 ft tall, 260 sq miles • Sits on Kalta, a large active volcano • Erupts every 40-80 yrs, 16x since 930 a.d. • Experiences Jökulhlaups, major flooding
Objective Introduction and Background Methodology: Data Collection Pre-Processing Classification Change Detection Accuracy Assessment Results and Discussion Implications
Data Collection:September 1973 Image • Landsat 1 • Multispectral Scanner System • 4 spectral bands • 79 meter spatial resolution
Data Collection: August 2006 Image • Landsat 7 • Enhanced Thematic Mapper Plus (ETM+) • 5 spectral bands • 30 meter spatial resolution
Classification: September 1973 Image • We used unsupervised classifications • Did four classes: non-ice/dry land, melted ice, soft ice, and ice
Classification: August 2006 Image May 312003 the scan line corrector failed making it difficult to classify images properly
Attribute Tables • Different number of pixels because of different satellite capabilities • 1973 image has 3,412,189 pixels • 2006 image has 48,397,584 pixels
Change Detection • Percent change values done by class • Overall 3.2% change
Change Detection • Using Polygon Geometry in ArcGIS • 1973 glacier was 304 sq miles • 2006 glacier was 266.5 sq miles • 37.5 square mile ice loss
Accuracy Assessment • Overall classification accuracy, 65 random points • 1973 image was 96% accurate • 2006 image was 75% accurate
Problems • Classifier miss-classified data making percent change of pixels non-representative • Image availability • Landsat 1 vs. Landsat 7 images • Scan line error • Cloud cover • Creating Vector images for polygons