Download
1 / 1
20 likes | 165 Vues
Results. Conclusions. The incorporation of textural cloud parameters increased the performance in the discrimination between convective and stratiform rain clouds. PCR2 outperforms the other three algorithms when verifying against the dependent dataset

E N D
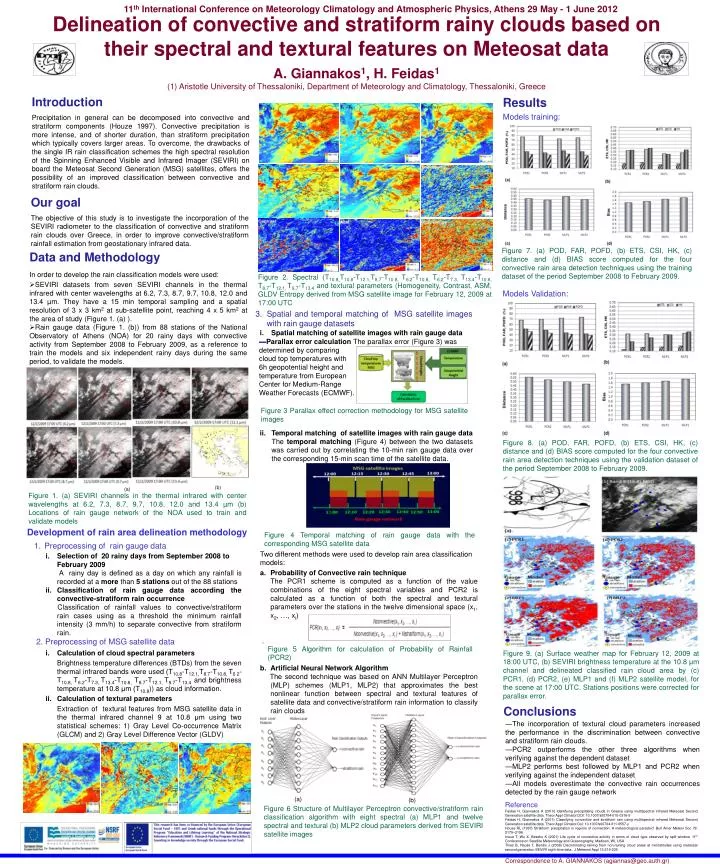
Results Conclusions • The incorporation of textural cloud parameters increased the performance in the discrimination between convective and stratiform rain clouds. • PCR2 outperforms the other three algorithms when verifying against the dependent dataset • MLP2 performs best followed by MLP1 and PCR2 when verifying against the independent dataset. • All models overestimate the convective rain occurrences detected by the rain gauge network 11th International Conference on Meteorology Climatology and Atmospheric Physics, Athens 29 May - 1 June 2012 Delineation of convective and stratiform rainy clouds based on their spectral and textural features on Meteosat data A. Giannakos1, H. Feidas1 (1) Aristotle University of Thessaloniki, Department of Meteorology and Climatology, Thessaloniki, Greece Introduction Precipitation in general can be decomposed into convective and stratiform components (Houze 1997). Convective precipitation is more intense, and of shorter duration, than stratiform precipitation which typically covers larger areas.To overcome, the drawbacks of the single IR rain classification schemes the high spectral resolution of the Spinning Enhanced Visible and Infrared Imager (SEVIRI) on board the Meteosat Second Generation (MSG) satellites, offers the possibility of an improved classification between convective and stratiform rain clouds. Models training: Our goal The objective of this study is to investigate the incorporation of the SEVIRI radiometer to the classification of convective and stratiform rain clouds over Greece, in order to improve convective/stratiform rainfall estimation from geostationary infrared data. Figure 7. (a) POD, FAR, POFD, (b) ETS, CSI, HK, (c) distance and (d) BIAS score computed for the four convective rain area detection techniques using the training dataset of the period September 2008 to February 2009. • Data and Methodology • In order to develop the rain classification models were used: • SEVIRI datasets from seven SEVIRI channels in the thermal infrared with center wavelengths at 6.2, 7.3, 8.7, 9.7, 10.8, 12.0 and 13.4 µm. They have a 15 min temporal sampling and a spatial resolution of 3 x 3 km2 at sub-satellite point, reaching 4 x 5 km2 at the area of study (Figure 1. (a) ). • Rain gauge data (Figure 1. (b)) from 88 stations of the National Observatory of Athens (NOA) for 20 rainy days with convective activity from September 2008 to February 2009, as a reference to train the models and six independent rainy days during the same period, to validate the models. Figure 2. Spectral (Τ10.8,Τ10.8-Τ12.1,Τ8.7-Τ10.8, Τ6.2-Τ10.8, T6.2-T7.3, Τ13.4-Τ10.8, Τ8.7-Τ12.1, Τ9.7-Τ13.4 and textural parameters (Homogeneity, Contrast, ASM, GLDV Entropy derived from MSG satellite image for February 12, 2009 at 17:00 UTC Models Validation: Spatial and temporal matching of MSG satellite images with rain gauge datasets Spatial matching of satellite images with rain gauge data ▬Parallax error calculation The parallax error (Figure 3) was determined by comparing cloud top temperatures with 6h geopotential height and temperature from European Center for Medium-Range Weather Forecasts (ECMWF). Figure 3 Parallax effect correction methodology for MSG satellite images Temporal matching of satellite images with rain gauge data The temporal matching (Figure 4)between the two datasets was carried out by correlating the 10-min rain gauge data over the corresponding 15-min scan time of the satellite data. Figure 8. (a) POD, FAR, POFD, (b) ETS, CSI, HK, (c) distance and (d) BIAS score computed for the four convective rain area detection techniques using the validation dataset of the period September 2008 to February 2009. Development of rain area delineation methodology (b) (a) Figure 1. (a) SEVIRI channels in the thermal infrared with center wavelengths at 6.2, 7.3, 8.7, 9.7, 10.8, 12.0 and 13.4 µm (b) Locations of rain gauge networkof the NOA used to train and validate models Figure 4 Temporal matching of rain gauge data with the corresponding MSG satellite data Preprocessing of rain gauge data • Two different methods were used to develop rain area classification models: • Probability of Convective rain technique • The PCR1 scheme is computed as a function of the value combinations of the eight spectral variables and PCR2 is calculated as a function of both the spectral and textural parameters over the stations in the twelve dimensional space (x1, x2, …, xi) • . • Artificial Neural Network Algorithm • The second technique was based on ANN Multilayer Perceptron (MLP) schemes (MLP1, MLP2) that approximates the best nonlinear function between spectral and textural features of satellite data and convective/stratiform rain information to classify rain clouds Selection of 20 rainy days from September 2008 to February 2009 A rainy day is defined as a day on which any rainfall is recorded at a more than 5 stations out of the 88 stations Classification of rain gauge data according the convective-stratiform rain occurrence Classification of rainfall values to convective/stratiform rain cases using as a threshold the minimum rainfall intensity (3 mm/h) to separate convective from stratiform rain. Calculationof cloud spectral parameters Brightness temperature differences (BTDs) from the seven thermal infrared bands were used (Τ10.8-Τ12.1,Τ8.7-Τ10.8, Τ6.2-Τ10.8, T6.2-T7.3, Τ13.4-Τ10.8, Τ8.7-Τ12.1, Τ9.7-Τ13.4 and brightness temperature at 10.8 μm (Τ10.8)) as cloud information. Calculation of textural parameters Extraction of textural features from MSG satellite data in the thermal infrared channel 9 at 10.8 μm using two statistical schemes: 1) Gray Level Co-occurrence Matrix (GLCM) and 2) Gray Level Difference Vector (GLDV) 2. Preprocessing of MSG satellite data Figure 5 Algorithm for calculationof Probability of Rainfall (PCR2) Figure 9. (a) Surface weather map for February 12, 2009 at 18:00 UTC, (b) SEVIRI brightness temperature at the 10.8 μm channel and delineated classified rain cloud area by (c) PCR1, (d) PCR2, (e) MLP1 and (f) MLP2 satellite model, for the scene at 17:00 UTC. Stations positions were corrected for parallax error. Figure 6 Structure of Multilayer Perceptron convective/stratiform rain classification algorithm with eight spectral (a) MLP1 and twelve spectral and textural (b) MLP2 cloud parameters derived from SEVIRI satellite images (a) (b) Reference Feidas H, Giannakos A (2010) Identifying precipitating clouds in Greece using multispectral infrared Meteosat Second Generation satellite data. Theor Appl Climatol DOI: 10.1007/s00704-010-0316-5 Feidas H, Giannakos A (2011) Classifying convective and stratiform rain using multispectral infrared Meteosat Second Generation satellite data. Theor Appl Climatol Doi: 10.1007/s00704-011-0557-y Houze RL (1997) Stratiform precipitation in regions of convection: A meteorological paradox? Bull Amer Meteor Soc 78: 2179–2196 Inoue T, Wu X, Bessho K (2001) Life cycle of convective activity in terms of cloud type observed by split window. 11th Conference on Satellite Meteorology and Oceanography, Madison, WI, USA Thies B, Nauss Τ, Bendix J (2008) Discriminating raining from non-raining cloud areas at mid-latitudes using meteosat second generation SEVIRI night-time data. J Meteorol Appl 15:219-230 Correspondence to A. GIANNAKOS (agiannas@geo.auth.gr)