Download
1 / 17
170 likes | 435 Vues
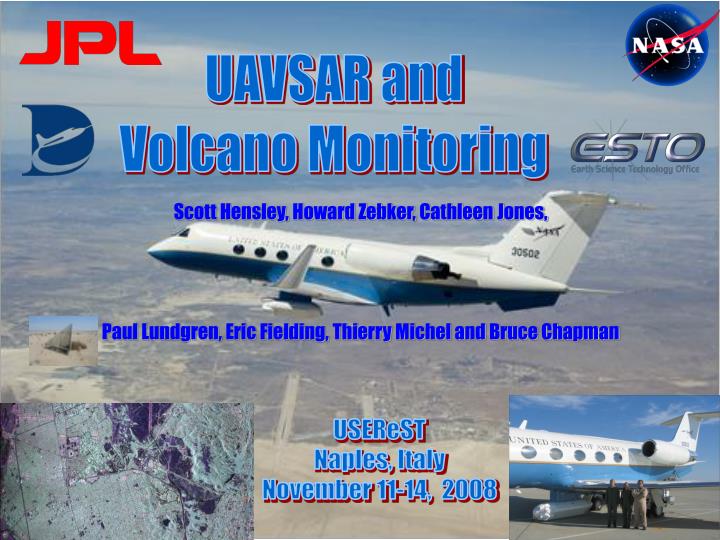
UAVSAR and Volcano Monitoring. Scott Hensley, Howard Zebker, Cathleen Jones, Paul Lundgren, Eric Fielding, Thierry Michel and Bruce Chapman. USEReST Naples, Italy November 11-14, 2008. UAVSAR.

E N D
UAVSAR and Volcano Monitoring Scott Hensley, Howard Zebker, Cathleen Jones, Paul Lundgren, Eric Fielding, Thierry Michel and Bruce Chapman USEReST Naples, Italy November 11-14, 2008
UAVSAR • UAVSAR is an L-band fully polarimetric SAR employing an electronically scanned antenna that has been designed to support a wide range of science investigations. • Science investigations supported by UAVSAR include solid earth, cryospheric studies, vegetation mapping and land use classification, archeological research, soil moisture mapping, geology and cold land processes. • To support science applications requiring repeat pass observations such as solid earth and vegetation applications the UAVSAR design incorporates: • A precision autopilot developed by NASA Dryden that allows the platform to fly repeat trajectories that are mostly within a 5 m tube. • Compensates for attitude angle changes during and between repeat tracks by electronically pointing the antenna based on attitude angle changes measured by the INU. • UAVSAR is testing new experimental modes, e.g. the multi-squint mode whereby data is collected simultaneously at multiple squint angles to enable vector deformation measurements with a single repeat pass.
Need for Airborne RPI Instrument • Spaceborne repeat pass radar interferometry derived deformation measurements has become a standard tool for the solid earth science and glaciological science communities. • Repeat times controlled by the the repeat orbit cycle of spaceborne SAR systems, e.g. ERS-1,2 (35 days), Radarsat (24 days), JERS (44 days), and Envisat ( 35 days). • Rapidly deforming features such as some volcanoes and glaciers or deformation from post seismic rebound require repeat times of a day or less to fully study the time varying nature of the deformation signal. • Repeat pass airborne interferometric measurements are more difficult to make because • The difficulty of flying a specified trajectory with the required accuracy • To need to compensate for pointing changes between flight tracks
UAVSAR and Volcano Observations • Although a number of the world’s active volcanoes have continuous seismic and/or GPS monitoring there is still a large number that are not persistently monitored. • Placing in situ monitoring devices on volcanoes after they enter more active states can be dangerous and usually only a few such devices can be deployed leading to an under sampling of the resulting deformation. • UAVSAR is ideally suited to making repeat pass observations of volcanic regions: • It has a large swath in excess of 20 km with fully polarimetric observations and flies at high altitudes (> 12.5 km) with a resolution of 1.6 m in range and 1m in azimuth. • Operates at L-band to reduce temporal decorrelation. • It can be tasked to make repeat observations on time scales as short as 20 minutes from any desired look direction. • It can control its flight path to be within a 10 m tube (usually within 5 m) and adjust its look direction electronically to compensate for aircraft attitude changes. • Has a vector deformation capability whereby vector deformation (and atmospheric distortions - under investigation) can be simultaneously determined. • Can be rapidly deployed to monitor evolving volcano hazards or routinely tasked to monitor more quiescent volcanoes.
Differential Low Voltage Signaling Single-ended Low Voltage Signaling ESS ESS ESS Aircraft 28V DC / DC TR 1 TR 2 TR 3 TR 4 TR 5 TR 6 TR 7 TR 8 TR 9 TR 10 TR 11 TR 12 RF manifold RF manifold ASN RF TR 13 TR 14 TR 15 TR 16 TR 17 TR 18 TR 19 TR 20 TR 21 TR 22 TR 23 TR 24 Diff to single CTU TRAC ESS ESS ESS Antenna Overview • 24 T/R Modules • 3 RF Manifold BoardsASN • 6 power only ESSs • Differential low voltage daisy • chain signaling • TRAC
UAVSAR Modes Polarimetric SAR Strip Mode SAR Multi-Squint Vector Deformation CoPol Monopulse
Example Repeat Pass Baselines San Andreas Fault Repeat-Pass Baseline 80 km Datatakes on February 12 and 20 of 2008. 10 m Tube 10 m Tube 5 m Tube 5 m Tube 10 m Tube 5 m Tube
Repeat Pass Processing Challenges • Repeat pass processing of airborne data is very challenging for several reasons: • First, the onboard motion metrology (INU and DGPS) are not sufficient to support automated processing of the data. Best case the INU+GPS combination provide 3 cm antenna phase center flight path reconstruction, whereas the needed accuracy is 1 mm or less. This means residual motion between passes must be solved for from the data themselves. • The motion compensation algorithm, which corrects the SAR data from an irregular flight path to a reference trajectory, is terrain dependent. This imposes additional processing complexity and reduces throughput. • Effective phase center changes resulting from electronically steering the antenna must be compensated on a pulse-by-pulse basis to avoid phase discontinuities in the differential interferograms. • Repeat pass processing presently involves a large amount of touch labor particularly with respect to the residual motion estimation. This problem is complicated due to: • Temporal decorrelation results in loss of signal which impedes the ability to estimate residual motion. • Deformation signals in the cross line-of-sight direction couple with residual motion errors hence making estimation of residual motion in the region where deformation is occurring extremely difficult.
Mt St Helens - UAVSAR March 24, 2008 Flight Direction > 20 km • Fully polarimetric image of Mt St Helens collected on March 24, 2008 by the UAVSAR radar. A second acquisition was collected on March 31, 2008.
Expanded View of Caldera and Dome AIRSAR December 2004
Mt St Helens Interferogram - 4 hour Repeat • This is a first cut interferogram - no offset measurements - no motion correction - no topography correction • Since time between observations is 4.2 hours or .174 days, the estimated rate of motion for an approximate radians of phase change is Phase (rad)
Mt St Helens - UAVSAR March 24, 2008 Flight Direction > 20 km • Two fully polarimetric image of Mt St Helens collected on March 24, 2008 by the UAVSAR radar separated by 4 hours. A second acquisition was collected on March 31, 2008. • Deformation of 37 cm/day and 15 cm/day observed on the two tongues of the glaciers in the caldera. • Refined processing underway to look for deformation on dome.
Multi-Squint Mode Example • Data collected in the UAVSAR multi-squint mode. Yaw angle of -5.0° with azimuth steering angles of 13.6° and -6.2°. • Anthropogenic features exhibit strong viewing angle scattering signatures. Azimuth Steering Angle: 13.6° -5° -5° 13.6° -6.2° Azimuth Steering Angle: -6.2°
UAVSAR Status • UAVSAR is an actively scanned fully polarimetric L-band SAR designed to meet a range of remote sensing applications of interest to the science community including specific features to support repeat pass interferometry for deformation studies. • UAVSAR platform is completing modifications to extend its range and increase the number of airports it can be deployed. • The system is expected to be available to the general science community starting in late 2008 with a number of investigators already funded for data collections.