Download

1 / 12
120 likes | 367 Vues
Introduction to Inferential Statistics. Inferential Statistics. Statistical techniques used to make generalizations from samples to populations through drawing inferences from the existing data to reach conclusions that extend beyond the immediate data alone 2 types Estimation

E N D
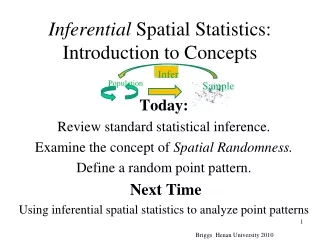
Inferential Statistics • Statistical techniques used to make generalizations from samples to populations through drawing inferences from the existing data • to reach conclusions that extend beyond the immediate data alone • 2 types • Estimation • Hypothesis Testing (Hyp Test)
Hypothesis Testing – Stating the Hypothesis • Null Hypothesis (Ho) • States that there is NO relationship and/or NO differencebetween the variables • Statement of equality • States that the findings are due to error; purely chance • Examples (also see Table B4 Handout from Class) • Ho :Sleep deprivation has no effect on performance. • Ho : There is no relationship between reaction time and problem-solving ability • Ho : There is no difference in the average score of 9th graders and the average score of 12th graders on a depression scale.
Stating the Hypothesis • Research (Alternative) Hypothesis (Ha) or (H1) • States that there IS a relationship and/or there IS a differencebetween the variables • Due to a real effect plus chance variation • Can be one or more than one (Ha) • Statements of inequality • Can be directional (one-tailed) or non-directional (two-tailed) • Examples • Ha :Sleep deprivation has an effect on performance. • Ha : There is a direct relationship between reaction time and problem-solving ability • Ha : The average score of 9th graders is higher than the average score of 12th graders on a depression scale.
Type I and II Errors • Type I • Reject the Null when the Null is true • Type II • Accept the Null when the Alternative is true
How Inference Works • The researcher selects representative samples of 2 groups of subjects/objects • samples are representative of the population from which they are chosen • Each subject/object is subjected to some type of treatment/test and data is collected to be compared • A conclusion is made as to whether or not the difference/lack there of, is due to error • Generalizations are made back to the population
Hypothesis Testing • Steps in Hypothesis Testing • State the Hypotheses • State the Null Hypothesis • State the Research (Alternative) Hypothesis • Choose and compute (from raw data) the appropriate Test Statistic • Determine the value needed to reject the Null (from a critical value chart) • Compare the obtained value and the critical value • Make a decision and state the conclusion
Hypothesis Testing - Regression • Looking at the relationship between the quality of marriage and the quality of the parent/child relationship • State the Hypotheses • State the null hypothesis • Ho: Pxy = 0 There is no relationship between quality of marriage and quality of the parent/child relationship. • State the research hypothesis • H1: Pxy ≠ 0 There is a relationship between quality of marriage and quality of the parent/child relationship. • Two tailed test • Compute the appropriate test statistic • Can use sample r value as test statistic by comparing it to critical values chart (Table B4) • Or can follow Flow Chart – t Test
Choosing the Appropriate Test Statistic Each Ho has an associated test statistic F-test F-test
Choosing/Computing the Appropriate Test StatisticSet the Appropriate Threshold • Once the appropriate test statistic type is chosen, the value is computed based on the data collected • rxy = .393 • Computed from the data in Table B4 Handout • Referred to as the Obtained Value • Set the appropriate threshold (α) • The value that the p-value must be below in order for the findings to be statistically significant • Based on industry standards/previous research • Typically never above .05 • For this course, our threshold value will be α = .05
Hypothesis Testing - Regression • Determine the critical value • Value needed to reject the Null Hypothesis • Located from Critical Value charts or software packages • Must know the threshold and df, and tailed-ness (one/two) • threshold value α = .05 • Determine the degrees of freedom (df) • Approximates the sample size • Different for each test statistic • For our test statistic, df = n-2 (n = 29) • df = 29-2 df = 27 • Using the αand df and two-tailed, to find the critical r value in the chart • Two tailed , α =.05, df = 30 as it is the closest next highest value to our df • Critical r value = .349