Download
1 / 22
220 likes | 420 Vues
Measuring Noise. Presented By: Kelly McKirahan Colorado School of Mines. Mentor: Dr. Dragana Popovic. Outline. What is Noise? Common types of noise The HP35665A Dynamic Signal Analyzer Thermal Noise Boltzmann’s Constant Second Spectra The differences between Rock and Classical Music.

E N D
Measuring Noise Presented By: Kelly McKirahan Colorado School of Mines Mentor: Dr. Dragana Popovic
Outline • What is Noise? • Common types of noise • The HP35665A Dynamic Signal Analyzer • Thermal Noise • Boltzmann’s Constant • Second Spectra • The differences between Rock and Classical Music
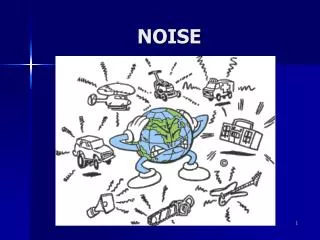
General Information • What is Noise? • General. Random changes or fluctuations of some parameter over time. • Where can you find noise? • Everywhere. • Price on stock exchange • Floods on the River Nile • Earthquakes in California • Transistors European Space Agency. Nile River Time Series. http://search.msn.com/images/details.aspx?q=nile+river&color=both&size=1p&ht=384&wd=512&tht= 96&twd=128&su=http%3a%2f%2fearth.esa.int%2friverandlake%2fsamples%2fsamples_africa_aswandam_img4.htm&iu=http%3a%2f%2fearth.esa.in t%2friverandlake%2fsamples%2flocations%2faswandam%2fimages%2fnile_height_diff_f.png&tu=http%3a%2f%2fimages.picsearch.com%2fis%3f18 41053082687&sz=11 Egyptians. The Story of the Nile. http://search.msn.com/images/details.aspx?q=nile+river&color=both&size=1p&ht=146&wd=196&tht=95&twd=128&su= http%3a%2f%2fwww23.thdo.bbc.co.uk%2fhistory%2fancient%2fegyptians%2fnile_02.shtml&iu=http%3a%2f%2fwww23.thdo.bbc.co.uk%2fhistory%2fa ncient%2fegyptians%2fimages%2fnile_01.jpg&tu=http%3a%2f%2fimages.picsearch.com%2fis%3f8501053249664&sz=12
Common Types of Noise • White Noise • Johnson-Nyquist / Thermal Noise • Pink Noise, excess noise • Shot Noise
What Is Johnson-Nyquist Noise? • Observed by Johnson in 1927 • Theory completed in 1928 by Nyquist • The noise stems from the thermal movement of the electrons. • All electrical components generate noise. • The noise increases as temperature increases. • Johnson noise could be used as a thermometer. J.B. Johnson. Thermal Agitation of Electricity in Conductors. http://prola.aps.org/pdf/PR/v32/i1/p97_1
e- e- e- e- e- e- e- e- e- e- e- e- e- e- e- e- e- e- e- e- e- e- e- e- e- e- e- e- e- e- e- Johnson-Nyquist Noise Voltage
Sine Signal Log Noise Power (dB) Frequency (kHz) Voltage • Spectrum: Signal decomposed into a sine wave. Time (ms)
White Noise • Consists of equal amounts of all frequencies. Voltage Time (ms)
White Noise • Consists of equal amounts of all frequencies. • The power is independent of frequency. Voltage Time (ms) Noise Power The electromagnetic spectrum. http://imagers.gsfc.nasa.gov/ems/visible.html Frequency (kHz)
Pink Noise • Distinguishable by larger fluctuations in the lower frequencies. Voltage Time (ms)
Pink Noise • Distinguishable by larger fluctuations in the lower frequencies. • Power spectrum is inversely proportional to frequency, 1/f. Voltage Time (ms) Noise Power The electromagnetic spectrum. http://imagers.gsfc.nasa.gov/ems/visible.html Frequency (kHz)
Shot Noise • Occurs because electric charge is quantized. • Distinguishable from Johnson-Nyquist Noise because noise of the electric current is included. The Blue Ridge Parkway Foundation. http://search.msn.com/images/details.aspx?q=Blue+ Ridge+Parkway&color=both&size=1p&ht=240&wd=370&tht=83&twd=128&su=http%3a%2f% 2fwww.brpfoundation.org%2findex.php&iu=http%3a%2f%2fwww.brpfoundation.org%2fimages %2fHomePhoto.jpg&tu=http%3a%2f%2fimages.picsearch.com%2fis%3f228759526445&sz=146 Blue Ridge Parkway. http://www.georgiazclub.com/photos/blue2.jpg
e- e- e- e- e- e- e- e- e- e- e- e- e- e- e- e- e- e- e- e- Shot Noise A A
Project HP35665A Motivation: To create a LabVIEW program to interface the computer with the dynamic signal analyzer.
Thermal Noise • Motivation: To measure Boltzmann’s constant at three specified temperatures using electronic noise. • Temperatures: • Room Temperature (~ 300K) • Liquid Nitrogen (77K) • Liquid Helium (4.2K) • Result: 1.88E-23 J/K • Boltzmann’s Constant: 1.381E-23 J/K Log d<V2> Log T Riedon. “Precision Metal Film Resistors,” http://search.msn.com/images/details.aspx?q=metal+film+resistors&color=both&size=1p&ht=116&wd=200&tht=74&twd=128&su=http%3a%2f%2fwww.riedon.com%2fmf.htm&iu=http%3a%2f%2fwww.riedon.com%2fimages%2fmf_series.gif&tu=http%3a%2f%2fimages.picsearch.com%2fis%3f603548391686&sz=5
Constructing a Second Spectra Step 1: Input a signal for analysis. HP35665A Step 2: The HP35665A DSA performs a Fourier Transform on the signal and outputs data.
Noise Power Frequency (kHz) Step 3: Use LabVIEW interface to collect the data. Noise Power Number of Points Step 4: Look at a specific frequency bandwidth of the signal.
Noise Power Frequency (kHz) Step 5: Average the frequency bandwidth over a number of spectrums. Noise Power Noise Power Frequency (kHz) Frequency (kHz) Plot the power spectrum of the average. This is the “noise of the noise.” Step 6: NoisePower Number of Points
Step 7: Lastly, the Fourier transform is performed on the power spectrum to obtain the second spectra. Weezer “Haunt Your Every Day” Second Power Spectra Second Frequency
Second Spectra Slope = -0.0305 Slope = -1.56 Slope = -0.674 Second Power Spectra Slope = -1.36 Second Spectra Frequency
Conclusion • The analyzer was used to investigate different audio signals. • Speech has a white second spectrum. • Classical music has a pink second spectrum. • Rock music is between classical music and speech. • The greater impression on the listeners the pinker the second spectra.
Special Thanks To • Dr. Dragana Popovic • Scholar ScientistScience, Condensed Matter / Experimental • Dr. Jan J. Jaroszynski • Visiting ScientistDirector's Office, Visitor's Program NSF NHMFL CIRL Staff Ms. Gina C. LaFrazza Assistant Director Director's Office, Center for Integrating Research & Learning • Ms. Ivana Raicevic • Graduate Research AssistantScience, Condensed Matter / Experimental • Dr. Marko Dragosavac • Postdoctoral AssociateScience, Condensed Matter / Theory