Download
1 / 43
430 likes | 494 Vues
Week 10 April 5. Subquery and Thresholds Graphics Builder and Forms. The Importance of ORDER BY. Relying on Fate…. View name. What’s the Problem?. Ordered by record labels!. 140 rows. All 2001. Paste the New Query into the Dialog Box. Revised Graph. Too many lines!.

E N D
Week 10April 5 Subquery and Thresholds Graphics Builder and Forms
Relying on Fate… View name
140 rows All 2001
Revised Graph Too many lines!
Reduce the Number of Record Labels Top 7 record labels in sales
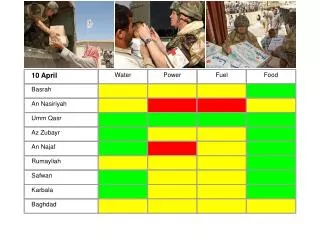
Create a set of threshold values Every record label must beat every value in this set, OR simply every record label must beat the highest (i.e., maximum) value in this set Highest value
REC 2001 2002 2003 2004 2005 --- ----------- ---------- ---------- ----------- ----------- RCA 98562.8896126.71 99773.52 112097.35 108383.42 COL 2285882.3 2336707.93 2472875.7 2635497.41 2621255.29 GRP 448870.6 469021.43 480428.06 531105.46 518445.68 GTS 156955.23 154830.01 174953.32 196814.02 200256.45 WB 571478.66 576644.41 580731.48 587747.77 563445.49 ARI 638935.25 628407.24 625556.25 644993.73 601378.96 KUC 48260.05 40662.4 36247.64 35417.3 30704.89 VER 188098.59 202036.86 209501.61 245316.62 269777.58 DOM 106147.96 120980.78 118289.17 116859.98 120437.15 LIB 42279.47 42602.71 35975.38 39944.48 57172.18 S/A 116819.02 131737.36 122668.75 137014.64 167739.88 CAP 1019419.4 1007901.07 972170.61 1005423.39 976683.56 KOK 59802.31 82005.05 78328.95 78980.63 85922.7 SHA 62003.69 81029.3 94834.46 120347.68 128159.91 DSY 104735.01 97572.02 83157.61 88339.8 98077.64 MCA 343229.06 345217.11 365019.64 392166.76 381035.82 MER 69748.69 69507.16 66263.35 61333.23 55619.23 MOT 252342.84 263438.36 259107.84 290508.9 300567.62 NAS 75892.67 91443.5 118311.33 172166.27 191768.39 PM 350717.42 354469.91 355604.56 363074.29 378489.29 WH 364718.11 374305.23 405000.86 483654.29 490804.67 CHS 62510.26 76541.45 109559.04 106997.1 93288.6 GEF 70964.37 70399.53 70265.02 85641.58 88666.07 APL 257074.33 296953.73 311523.14 324438.59 291354.25 ATL 1017378.32 1023850.51 993520.05 1082629.88 1117300.7 E/A 83585.13 81487.22 99320.6 110026.61 118170.16 EMI 70391.52 71098.97 75852.13 69773.29 55397.99 POL 469854.45 467419.28 485843.36 502552.77 453941.7 Yes Yes Yes Yes YEAR THRESHOLD ---- ---------- 2001 330283.016 2003 346523.920 2005 369748.584 2002 337903.903 2004 371730.234 Yes Highest Eliminate the ones with red Yes Yes
Working Backwards • Create a set of all record labels that have all sales values greater than those found in the set of thresholds All record labels must beat all threshold values (or simply the minimum sales value must beat the maximum threshold value)
Retrieve all record labels annual sales of those with minimum sales exceeding all values found in the thresholds Subquery: Select only those record labels that exist in the set that contains record labels with sales values greater than all threshold values 35 rows
Anatomy of the Subquery Basic Query for the Data Model: select category, year, sales from view1 alias1 where exists (select category, min(sales) from view1 alias2 where alias1.category = alias2.category group by category having min(sales) > all (select threshold from view2)) Retrieves only those category members that are found in the set produced by the first subquery Creates a set of category members whose minimum sales must be greater than all threshold values Creates a set of threshold values
A Few Simple Steps for Creating a Graph(From Last Week) • Build the initial SQL command in SQL Plus • In Graphics Builder • Build the data model • Build the graph • Select the graph type • Assign the independent and dependent to the categories and values, respectively • Format the various components of graph as needed • Save and run the graph
Layout Editor Tool palette Chart tool - Create data model and graph
A few steps later… After Building the Graph
Generating an OGR File From the File menu, select Administration, Generate and File System Be sure to generate a new OGR file every time a change is made to the OGD file.
Generating an OGR File Save the file
Create a Chart Item on the Canvas Select Data Block and the create tool in the tool palette
Create a Chart Item on the Canvas Select Build a new data block manually and click on OK
Create a New Item in the Data Block Select Items and click on the Create Tool in the tool palette
Change the Item’s Property Right-mouse click the item (e.g., ITEM5) and select Property Palette
Change the Item Type Property 1. Change the Item Type propertyfrom Text Item to Chart Item
Change the Canvas Property 2. Change the Canvas property from <Null> to the canvas’ name (e.g., CANVAS2) 3. Close the Property Palette
Attach the OG.PLL File Select Attached Libraries and click on the create tool in the tool palette
Locate and Attach the OG.PLL File 1. Click on Browse and search for the file 2. Select the file and click on Open Hint. Locate the OG.PLL file through a search in Windows Explorer and copy it into your working directory. It may be located under Developer’s \tools\devdem60\demo\forms subdirectory.
Attach the OG.PLL File 3. Click on Attach and select Yes (remove path)
1. Add a push button 2. Right-mouse click the push button and select PL/SQL Editor
Select a Trigger Select the WHEN-MOUSE-CLICK trigger and click OK
PL/SQL Open and close the OGR file Compile the PL/SQL code
Modify the Chart Item Properties Remove the bevel Change the Background Color to match the canvas