Download
1 / 33
330 likes | 546 Vues
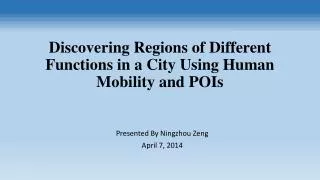
Discovering Regions of Different Functions in a City Using Human Mobility and POIs. Presented by Ivan Chiou. Jing Yuan Microsoft Research Asia v-jinyua@microsoft.com. Yu Zheng Microsoft Research Asia yuzheng@microsoft.com. Xing Xie Microsoft Research Asia xing.xie@microsoft.com.

E N D
Discovering Regions of Different Functions in a City UsingHuman Mobility and POIs Presented by Ivan Chiou Jing Yuan Microsoft Research Asia v-jinyua@microsoft.com Yu Zheng Microsoft Research Asia yuzheng@microsoft.com Xing Xie Microsoft Research Asia xing.xie@microsoft.com
Outline • Abstract • DRoF framework– Discovers Regions of different Functions. • Human mobility and points of interests POIs. • A region as a document, and topic as a function • Section 1: • Introduction • Section 2: • discover the distributions of functions for each region. • Section 3: • estimate the intensity of each function. • Section 4: • Evaluation results • Section 5: • Related works • Section 6: • Conclusion
Introduction – Object(1/2) • Aim to different functions in urban areas using human mobility and points of interests (POIs).
Introduction – Object(2/2) • Benefit • It can provide people with a quick understanding of a complex city and social recommendations. • calibrate the urban planning of a city and contribute to the future planning to some extent. • Benefit location choosing for a business and advertisement.
How to identify the functions of a region • Two Aspects • POI data: • Features the function of a region. • Cannot differentiate the function of restaurants for local residence and traveler. • Human mobility: • Correlation with traveler behavior • When people arrive at and leave region • Where people come from and leave for
Contributions • Three Contributions: • Propose a topic model-based method to identify the functions of individual regions. • Each function is titled with some tags in semi-manual way based on the output of our method. • Identify the functionality intensity in the regions belonging to the cluster. • Evaluated methods using large-scale and real-world datasets of Beijing. • 12000 taxi-cabs from 2010 to 2011 in Beijing.
Topic-model-based method(1/3) • Map segmentation • Red segment: highway and city express way • Blue segment: urban arterial roads • Each segment as a formal region • A formal region is a basic unit carrying social-economic functions.
Topic-model-based method(2/3) • Raster-based map • Benefit: efficient for territorial analysis. • But the accuracy is limited by number of cells • A binary image: • 0 to road segment and 1 to blank space.
Topic-model-based method(3/3) • Enhance Raster-based map • Step1: Smooth out the unnecessary details • Step2: Performing a thinning operation • Step3: Connected component labeling • Find individual regions by clustering “l” – labeled grids.
Topic discovery(1/2) • Preliminary • Definition1 • Definition2 • Definition3 • For example, setting 2 hours as a bin, we will have 24 bins (12 for weekdays and 12 for weekends) in total.
Topic discovery(2/2) • Concepts of Topic Models. • Latent DirichletAllocation(LDA) is a generative model that includes hidden variables • Assume there are K topics and is a K x V matrix where V is the number of words in the vocabulary (all the words in the corpus D). Each k is a distribution over the vocabulary. The topic proportions for the dth document are d, where dk is the topic proportion for topic k in the dth document.
Topic Modeling(1/4) • Aregion having multiple functions is just like a document containing a variety of topics.
Topic Modeling(2/4) • For example, in the right most column of the arriving matrix, the cell containing “5” means on average the mobility that went to r1 from rj in time bin tkoccurred 5 times per day.
Topic Modeling(3/4) • POI data • A POI is recorded with a tuple (in a POI database) consisting of a POI category • The frequency density vi
Topic Modeling(4/4) • In order to combine the information from both of them, we utilize a more advanced topic model based on LDA and DirichletMultinomial Regression (DMR) • DMR achieves similar or improved performance while is more computational efficient and succinct in implementation
TERRITORY IDENTIFICATION(1/3) • Region aggregation • Aggregates similar formal regions in terms of region topic distributions by performing a clustering algorithm. • Consequently, we aggregate the formal regions into k clusters, each of which is termed as a functional region.
TERRITORY IDENTIFICATION(2/3) • Functionality Intensity Estimation • estimate the functionality intensity for each aggregated functional region (a cluster of formal regions). • Use Kernel Density Estimation (KDE) model • we choose the Gaussian function as the kernel function(r)
TERRITORY IDENTIFICATION(3/3) • Region Annotation • annotate a functional region by considering the following 4 aspects • 1) compute an average POI feature vector across the regions in functional region. • 2) The most frequent mobility patterns of each functional region. • 3) The functionality intensity. • 4) The human-labeled regions
Evaluation Result(1/8) • datasets for the evaluation • Overall efficiency
Evaluation Result(2/8) • compare our method with two baselines • a) the TF-IDF-based Clustering • uses only the POI data. • b) LDA-based Topic Model • uses only the mobility data • As the number of POI categories usually has the same scale with that of the topics, applying the LDA model solely to POIs (as words) will not reduce the dimension of words.
Evaluation Result(3/8) • Three following difficult studies to evaluate the effectiveness of our framework • 1) invite some local people (who have been in Beijing for over 6 years) and request them to label two representative regions for each kind of function. • 2) find the evolving of Beijing by comparing the results of 2010 and 2011, and identify whether the differences make sense. • 3) We match our results against the land use planning of Beijing.
Evaluation Result(4/8) • Region Annotation
Evaluation Result(7/8) • Results in Different Years • For example, region A (Qianmen Street) becomes a developed commercial area from a nature/parkarea. The reason is that this region was developing in 2010 after a major repair since 2009. Similar to region A, region B (close to the new CBD of Beijing) becomes a developing commercial area from an under construction area.
Evaluation Result(8/8) • Calibration for Urban Planning • This area forms an emerging residential area as planned by the government, while some small regions become developing commercial areas, such as A, B and C after 2 years’ development.
Related work • Recently research • Urban computing with taxicabs • Discovery of functional regions • Never seen before in this research theme • Our research specific aspects • first one that simultaneously considers static features (POIs) of a region and interactions (human mobility) • propose a topic-model-based solution
Conclusion • Proposes a framework DRoFfor discovering regions of different functions using both human mobility and POIs. • Evaluated this framework with a two-year Beijing POI dataset and GPS trajectory datasets generated by over 12,000 taxis in year 2010 and 2011. • Matching the discovered functional regions against Beijing land use planning (2002-2010) • Future • further study to change over the scale of the data. • add other mobility data sources, such as cell-tower traces and check-ins in location-based services.
References • [1] J. Antikainen. The concept of functional urban area. Findings of the • Espon project, 1(1), 2005. • [2] S. Bednarz et al. Geography for Life: National Geography Standards, • 1994. National Geographic Society, PO Box 1640, Washington, DC • 20013-1640., 1994. • [3] D. Blei. Introduction to probabilistic topic models. Communications • of the ACM, 2011. • [4] D. Blei, A. Ng, and M. Jordan. Latent dirichlet allocation. The • Journal of Machine Learning Research, 3:993–1022, 2003. • [5] R. Estkowski. No Steiner point subdivision simplification is • NP-Complete. In Proc. 10th Canadian Conf. Computational • Geometry. Citeseer, 1998. • [6] Y. Ge, H. Xiong, A. Tuzhilin, K. Xiao, M. Gruteser, and M. Pazzani. • An energy-efficient mobile recommender system. In Proc. KDD ’10, • pages 899–908, 2010. • [7] C. Karlsson. Clusters, functional regions and cluster policies. JIBS • and CESIS Electronic Working Paper Series (84), 2007. • [8] L. Lam, S. Lee, and C. Suen. Thinning methodologies-a • comprehensive survey. IEEE Transactions on pattern analysis and • machine intelligence, 14(9):869–885, 1992. • [9] W. Liu, Y. Zheng, S. Chawla, J. Yuan, and X. Xing. Discovering • spatio-temporal causal interactions in traffic data streams. In Proc. • KDD ’11, pages 1010–1018, 2011. • [10] D. Mimno and A. McCallum. Topic models conditioned on arbitrary • features with dirichlet-multinomial regression. In Uncertainty in • Artificial Intelligence, pages 411–418, 2008. • [11] A. Pozdnoukhov and C. Kaiser. Space-time dynamics of topics in • streaming text. In Proc. LBSN ’11, pages 8:1–8:8, 2011. • [12] G. Qi, X. Li, S. Li, G. Pan, Z. Wang, and D. Zhang. Measuring social • functions of city regions from large-scale taxi behaviors. In IEEE • PERCOM Workshops, pages 384–388, 2011. • [13] P. Rousseeuw. Silhouettes: a graphical aid to the interpretation and • validation of cluster analysis. Journal of computational and applied • mathematics, 20:53–65, 1987. • [14] L. Shapiro and G. Stockman. Computer Vision. 2001. Prentice Hall, • 2001. • [15] R. R. Vatsavai, E. Bright, C. Varun, B. Budhendra, A. Cheriyadat, and • J. Grasser. Machine learning approaches for high-resolution urban • land cover classification: a comparative study. In ProcCOM.Geo ’11, • pages 11:1–11:10, 2011. • [16] M. Wand and M. Jones. Kernel smoothing, volume 60. Chapman & • Hall/CRC, 1995. • [17] Z. Yin, L. Cao, J. Han, C. Zhai, and T. Huang. Geographical topic • discovery and comparison. In Proc. WWW ’11, pages 247–256, 2011. • [18] J. Yuan, Y. Zheng, X. Xie, and G. Sun. Driving with knowledge from • the physical world. In Proc. KDD ’11, pages 316–324, 2011. • [19] J. Yuan, Y. Zheng, L. Zhang, X. Xie, and G. Sun. Where to find my • next passenger. In Proc. Ubicomp ’11, pages 109–118, 2011. • [20] Y. Zheng, Y. Liu, J. Yuan, and X. Xie. Urban computing with • taxicabs. In Proc. Ubicomp ’11, pages 89–98, 2011. • [21] Y. Zheng and X. Zhou. Computing with spatial trajectories. • Springer-Verlag New York Inc, 2011.
To be continued Presented by Ivan Chiou