Download
1 / 64
640 likes | 748 Vues
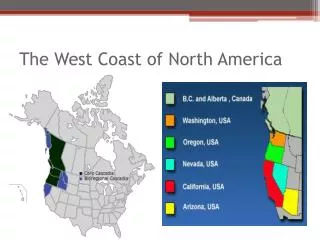
Observations of Storms off the West Coast in 2012 from Seafloor Data David Atkinson, UVic Dept. of Geography Steve Mihaly, ONC Dilumie Abeysirigunawardena, ONC Martin Heesemann, ONC 2013 CSAS State of Ocean Workshop February 20, 2013. Series of storm events, Jan 19 – 26, 2012:

E N D
Observations of Storms off the West Coast in 2012 from Seafloor Data • David Atkinson, UVic Dept. of Geography • Steve Mihaly, ONC • Dilumie Abeysirigunawardena, ONC • Martin Heesemann, ONC • 2013 CSAS State of Ocean Workshop • February 20, 2013
Series of storm events, Jan 19 – 26, 2012: • Synoptic overview • La Perouse traces • ONC Folger Passage (Deep) data: • surface waves • Start with annual variance and comparison, 2011 vs 2012 • BPR power spectra trace, late summer period • spring period close-up • storm period close-up • ADCP currents • storm event response • oxygen • storm event response
Series of storm events, Jan 19 – 26, 2012: • Synoptic overview. • - point to note: potential for different wave source regions during these events
January 19 2012 00Z • Typical progression: • - “parent” system moves off jet • into GoA • Dynamically linked systems • generated, moved towards • coast and to NE • -Support from aloft = • rapid increases in strength M
January 19 2012 06Z • La Perouse Bank buoy • Direction • Wspd,Hs M 6,4
January 19 2012 12Z M 10,4
January 19 2012 18Z M 7,3 1
January 20 2012 00Z M 6,2.5 1
January 20 2012 06Z M 1 11,3
January 20 2012 12Z M 1 15,3
January 20 2012 18Z M 1 15,4
January 21 2012 00Z M 1 16,5
January 21 2012 06Z 960 M 1 12,4 2
January 21 2012 12Z 960 M 1 11,4 2
January 21 2012 18Z M 11,5 2
January 22 2012 00Z M 10,6 2
January 22 2012 06Z M 11,6 2
January 22 2012 12Z M 2 977 18,6
January 22 2012 18Z M 977 2 20,7 3
January 23 2012 00Z M 2 977 22,9 3
January 23 2012 06Z M 2 10,7 3
January 23 2012 12Z M 7,6 4 3
January 23 2012 18Z M 4 9,4 3
January 24 2012 00Z M 4 5 10,4
January 24 2012 06Z M 4 5 14,4
January 24 2012 12Z M 4 5 14,6
January 24 2012 18Z 4 967 5 972 13,6
January 25 2012 00Z 4 964 968 5 12,5
January 25 2012 06Z 4 964 5 968 15,6
January 25 2012 12Z 4 5 10,8
January 25 2012 18Z 5 4 8,8
Max sustained wind ~23m/s (gust 30m/s) Wave height peaks >8m Note direction shifts
ONC Folger Passage (Deep) data : Wave activity expressed as variance
Annual: 2011 log
Annual: 2011 log More energetic, more variable winter season Less energetic/variable summer season
Annual: 2011 log February – activity appeared to be winding down - Kicked back in for an active March
Annual: 2012 log
Annual: 2012 Similar in general form to 2011 – winter active, summer quieter log
Annual: 2012 Timings – 2011 winter ended fairly suddenly; 2012 dragged out log
Annual: 2012 Timings – both years – late July/August very quiet, September sees increasing activity log July/Aug. Sept.
First three weeks of September 2012 locally were (very) storm free Observed energy can not be local.
Use a running spectral power plot of Folger BPR data to assess wave dispersion - angled tracks between 25s-10s indicate long period waves arriving well before shorter = wave trains pumped out by distant storms Relative power Wave Period Sept 1 2012 Sept 7 2012 Sept 14 2012 Sept 21 2012
Annual: 2012 Late Jan. Stormy period – most active single week in 2012 log
Spring: 2011 Closer look at variance traces for stormy period log spring JAN 01 FEB 01 MAR 01
Spring: 2011 log spring • Note pattern – waves often exhibit rapid onset, slow decline • Cordillera blocks eastern progression of storms • move in fast, but stall and die slowly JAN 01 FEB 01 MAR 01