Download
1 / 16
160 likes | 167 Vues
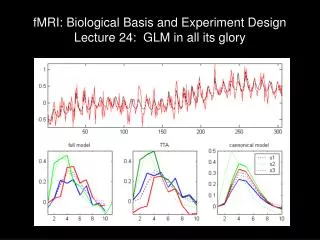
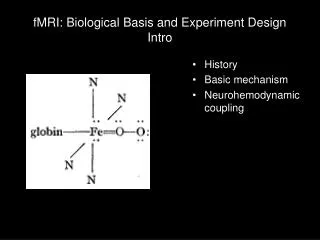
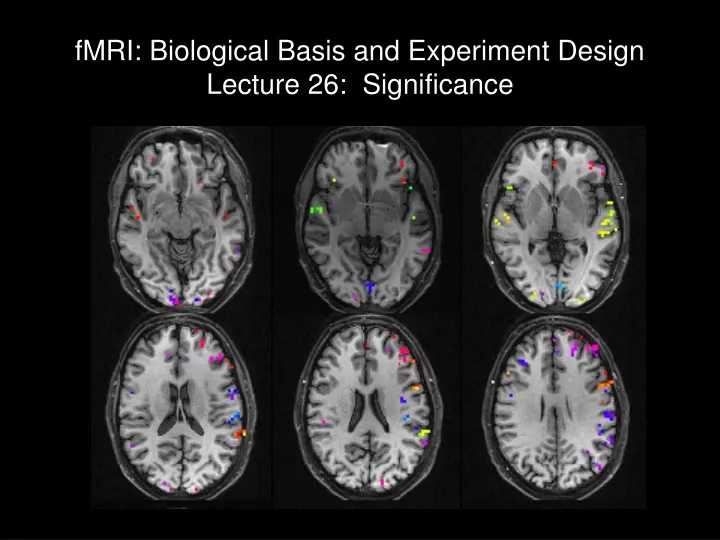
fMRI: Biological Basis and Experiment Design Lecture 26: Significance. Review of GLM results Baseline trends Block designs; Fourier analysis (correlation) Significance and confidence intervals. Noise in brains. Spatially correlated Big vessels Blurring in image

E N D
fMRI: Biological Basis and Experiment DesignLecture 26: Significance • Review of GLM results • Baseline trends • Block designs; Fourier analysis (correlation) • Significance and confidence intervals
Noise in brains • Spatially correlated • Big vessels • Blurring in image • Neural activity is correlated • Temporally correlated • Noise processes have memory
Noise in brains: spatial correlation • Spatial correlation: use one voxel as "seed" (template) – calculate correlation with neighbors (whole brain, if you have time ...) • Basis of functional connectivity Seed voxel
Picking a voxel not significantly modulated by the stimulus, we still see correlations locally
Correlation is not seen in white matter; organized in gray matter Picking a voxel in white matter, we still few correlated voxels either locally or globally. Picking a voxel significantly modulated by the stimulus, we still see correlations all over
Noise in brains: temporal correlation Uncorrelated noise Smoothed noise Time domain Frequency domain
Noise in brains: temporal correlation • Drift and long trends have biggest effects
Noise in brains: temporal correlations • (Missing slides, where I took 8 sample gray matter pixels and 8 sample white matter pixels and looked at the autorcorrelation function for each pixel)
Noise in brains: temporal correlation • How to detect? • Auto correlation with varying lags • FT: low temporal frequency components indicate temporal structure • How to compensate? • "pre-whiten" data (same effect as low-pass filtering?) • Reduce degrees of freedom in analysis.
Fourier analysis • Correlation with basis set: sines and cosines • Stimulus-related component: amplitude at stimulus-related frequency (can be z-scored by full spectrum) • Phase of stimulus-related component has timing information
Fourier analysis of block design experiment Time from stim onset: 0s 12s 24s
Significance • Which voxels are activated?
Significance: ROI-based analysis • ICE15.m shows a comparison of 2 methods for assigning confidence intervals to estimated regression coefficients • Bootstrapping: repeat simulation many times (1000 times), and look at the distribution of fits. A 95% confidence interval can be calculated directly from the standard deviation of this distribution (+/- 1.96*sigma) • Matlab’s regress.m function, which relies the assumption of normally distributed independent noise • The residuals after the fit are used to estimate the distribution of noise • The standard error of the regression weights is calculated, based on the standard deviaion of the noise (residuals), and used to assign 95% confidence intervals. • When the noise is normal and independent, these two methods should agree
Multiple comparisons • How do we correct for the fact that, just by chance, we could see as many as 500 false positives in our data? • Bonferonni correction: divide desired significance level (e.g. p < .05) by number of comparisons (e.g. 10,000 voxels) - display only voxels significant at p < .000005. • Too stringent! • False Discovery Rate: currently implemented in most software packages • “FDR controls the expected proportion of false positives among suprathreshold voxels. A FDR threshold is determined from the observed p-value distribution, and hence is adaptive to the amount of signal in your data.” (Tom Nichols’ website) • See http://www.sph.umich.edu/~nichols/FDR/