Download
1 / 19
190 likes | 303 Vues
Signal and background discrimination using matrix element. (the case of the top quark). F. Canelli, J. Estrada and G. Gutierrez University of Rochester - Fermilab November 8, 2001. Signal from background discrimination. Why are we remeasuring m t ?. Top quark physics.

E N D
Signal and background discrimination using matrix element. (the case of the top quark) F. Canelli, J. Estrada and G. Gutierrez University of Rochester - Fermilab November 8, 2001 J.Estrada- University of Rochester
Signal from background discrimination. Why are we remeasuring mt? • Top quark physics. • mt measurement at CDF and DØ during Run I. • Our approach • Implementation of our approach. • Conclusions. J.Estrada- University of Rochester
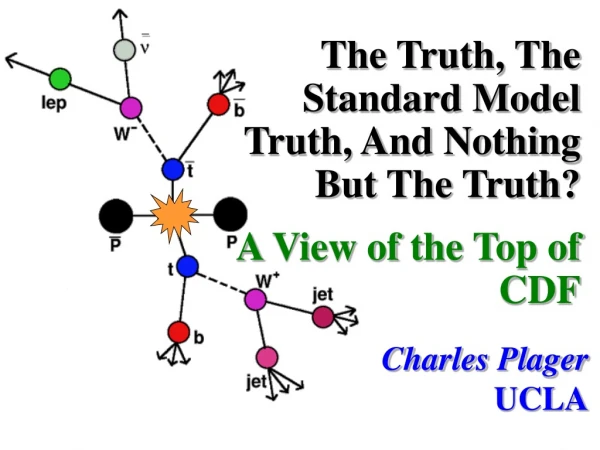
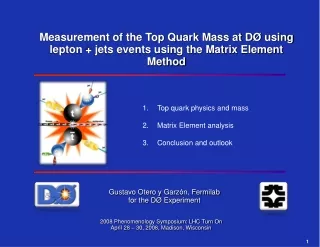
q b q W t n W l t b Top event topology and cuts The lepton + jets channels: because the lepton gives a good handle to select the events (less backg. than all-jets and more stat. than dilepton) 12 permutations • Cuts: • Lepton: Et>20 GeV,|e|<2,||<2 • Jets: 4, ET>15 GeV, ||<2 • Missing ET > 20 GeV • DØ Statistics (125 pb-1): • 29 signal + 48 backg. (.8 W+jets and .2 QCD) p p …a nice example to test a signal to background discrimination technique J.Estrada- University of Rochester
DØ and CDF published analysis • MC events are generated according to production probability (models in Herwig for signal and Vecbos for W+jets) and ran through the detector simulation to get : parameter to be measured x =(x1,…,x15): all measurements for the event • The probability is then parameterized in a few variables (less than 15 dimensions), the rest of the variables are integrated-averaged using the generated events. • A maximum likelihood is in general used to obtain the most probable value of . J.Estrada- University of Rochester
DØ top mass analysis (lepton+jets) • Four variables are used to parameterize signal and background probabilities (missing Et, A, HT2/Hz,x4). These variables are chosen to minimize the correlation with mt. A discriminant is defined as • A kinematic fit is performed to each event, in that way the permutation with best 2 is selected (correct in 40% of the cases) and a mfitis obtained for each event (the longitudinal momentum of the neutrino is also obtained from this constrained fit). Events with bad fit (2>10) are rejected. • P is parameterized in 2 dimensions (mfit,). Templates are obtained for different values of the MC top mass and then compared with the data in a likelihood function. J.Estrada- University of Rochester
DØ top mass analysis (lepton+jets), plots Published Result J.Estrada- University of Rochester
CDF top mass analysis (lepton+jets) • Kinematic fit is performed to obtain mfit for each event choosing one neutrino solution and one permutation (even though there is b tagging, there are still ambiguities in the jet-parton assignment). • P is parameterized in 1 dimension. Templates are obtained for different values of the MC top mass and then compared with the data in a likelihood function. Efficiency in the selection of the correct perm by the kinematic fit. (4)68% (12)54% 46% (24)42% Consistent with DØ J.Estrada- University of Rochester
CDF top mass analysis (lepton+jets) The error is on the low side of the distribution J.Estrada- University of Rochester
In general... One multidimensional template is obtained for each value of the mass, the data is then compared with those templates to find the most likely value for mt. Template(xi;mt=A) Template(xi;mt=B) Data => mt~B J.Estrada- University of Rochester
Our approach The probability for each event being signal is calculated as a function of the top mass. The probability for each event being background is also calculated. The results are combined in one likelihood for the sample. Something along this line was tried at CDF (Dalitz-Goldstein), but the implementation that we have is very different. Signal events. Backg. For each event signal and backg probabilities are added. The probabilities of individual events are multiplied. J.Estrada- University of Rochester
Difference Template New • All the events are presented to the same template. • The template is really a probability distribution for the whole sample is some variables calculated from MC simulations. • The features of individual events are integrated (averaged) over those variables not present in the template. • Smart selection of the variables for the template. • Each event has its own probability curve. • The probability depends on all measured quantities. • Each event has it own features in the probability depending how well it was measured. • No variable selection needs to be done, all variables are used. There is no information thrown away J.Estrada- University of Rochester
Results stat.err. [GeV] mass syst.err. data expected CDF DØ (new) J.Estrada- University of Rochester
Testing the new approach in MC 4 examples of likelihood functions. Each example correspond to one experiment with the statistics that DØ collected during Run I. The signal and background events were ran through the full DØ Run I simulation. J.Estrada- University of Rochester
S/B discrimination One can define a discriminator, in the same way it was done for the published analysis. In our approach we do not cut on this variable, but it gives an idea on how well we can distinguish our signal from background. J.Estrada- University of Rochester
Testing the new approach in MC. Linearity We have a slope consistent with 1.0. We can reproduce the input mass. J.Estrada- University of Rochester
MC ensemble test Direct comparison of our method with the NN analysis that published with the same data. J.Estrada- University of Rochester
MC test. W mass in the hadronic branch The likelihood can also be maximized for the mass of the W boson. Here some ensemble tests for the results on this maximization. J.Estrada- University of Rochester
Advantages of this approach • Statistical Error Improves because: • The correct permutation contributes for every event (not only 40%) giving effectively more statistics. • Features of individual events are included. Events are effectively weighted. • All information is used (no dimensionality reduction). • Once the probability is calculated the likelihood can be maximized for any parameter (in the example: top quark mass, W boson mass, helicity, and others spin correlation…) • The possibility of checking the value of the W mass in the hadronic branch on the same events gives a new handle to control the largest systematic error, the jet energy scale. J.Estrada- University of Rochester
Conclusion • We can directly use all our knowledge about the physics processes to separate signal from background with the differential cross sections for each process. • In the case of top quark: • Smaller expected statistical error in Mt (working hard to publish). • Check of Mw in the hadronic W decays (control over JES). • Measurement of the W helicity in ttbar event (F.Canelli). • Successfully demonstrated here a different approach for considering the mapping between measurement and parton quantities. J.Estrada- University of Rochester