Download
1 / 54
540 likes | 544 Vues
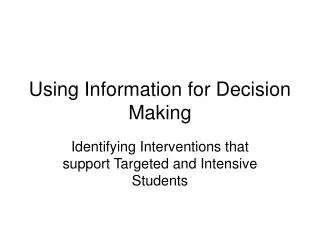
Using Information for Decision Making. Identifying Interventions that support Targeted and Intensive Students Susan Barrett www.pbis.org www.pbismaryland.org. Monitor Objectives & Outcomes. Big Idea:

E N D
Using Information for Decision Making Identifying Interventions that support Targeted and Intensive Students Susan Barrett www.pbis.org www.pbismaryland.org
Monitor Objectives & Outcomes • Big Idea: • The staff determine what they want to answer, what data will answer the question, the simplest way to get that data, and then write an objective for where they want to be in the future.
Questions How does the team use to data to: • Get 80% staff buy-in (staff survey, TIC) • Keep 80% buy-in (BIG 5, communication) • for problem solving across all teams/committees • Utililize the three-tiered model of prevention (integrate student services, academic support, teacher support)
Positive Behavior Support Supporting Decision Making Supporting Staff Behavior INFORMATION office discipline referrals PBS self assessment survey all staff (parents/students?) input academic progress attendance direct observation school improvement goal progress SYSTEMS School wide Non classroom Classroom Individual students PRACTICES define (behav. expect. & routines) teach acknowledge correct follow up & feedback consensus & collaboration Supporting Student Behavior
Why Collect Discipline Information? • Decision making • Professional Accountability • Decisions made with data (information) are more likely to be (a) implemented, and (b) effective
Key features of data systems that work. • The data are accurate • The data are very easy to collect (1% of staff time) • Data are used for decision-making • The data must be available when decisions need to be made (weekly?) • Difference between data needs at a school building versus data needs for a district • The people who collect the data must see the information used for decision-making.
What data to collect for decision-making? • USE WHAT YOU HAVE • Office Discipline Referrals/Detentions • Measure of overall environment. Referrals are affected by (a) student behavior, (b) staff behavior, (c) administrative context • An under-estimate of what is really happening • Office Referrals per Day per Month • Attendance • Suspensions/Expulsions • Vandalism
Office Discipline Referral Processes/Form • Coherent system in place to collect office discipline referral data • Faculty and staff agree on categories • Faculty and staff agree on process • Office Discipline Referral Form includes needed information • Name, date, time • Staff • Problem Behavior, maintaining function • Location
Minor Incident Reports • Overall Design • Smaller than referral • In triplicate • Replaced Detention Forms • Pre-Referral Documented Step • Flexible Consequences • Ex: Detention, reflection, parent signature, etc. • Administrative Intervention Before Referral
When Should Data be Collected? • Continuously • Data collection should be an embedded part of the school cycle not something “extra” • Data should be summarized prior to meetings of decision-makers (e.g. weekly) • Data will be inaccurate and irrelevant unless the people who collect and summarize it see the data used for decision-making.
Organizing Data for “Information” • Counts are good, but not always useful • To compare across months use “average office discipline referrals per day per month”
Using Data for On-Going Problem Solving • Start with the decisions not the data • Use data in “decision layers” • Is there a problem? (overall rate of ODR) • Localize the problem • (location, problem behavior, students, time of day) • Get specific • Don’t drown in the data • It’s “OK” to be doing well • Be efficient
Is there a problem? • Office Referrals per Day per Month • Attendance • Faculty Reports
Interpreting Office Referral Data:Is there a problem? • Absolute level (depending on size of school) • Middle Schools (>5 per day) • Elementary Schools (>1.5-2 per day) • Trends • Peaks before breaks? • Gradual increasing trend across year? • Compare levels to last year • Improvement?
What systems are problematic? • Referrals by problem behavior? • What problem behaviors are most common? • Referrals by location? • Are there specific problem locations? • Referrals by student? • Are there many students receiving referrals or only a small number of students with many referrals? • Referrals by time of day? • Are there specific times when problems occur?
Designing Solutions • If many students are making the same mistake it typically is the system that needs to change not the students. • Teach, monitor and reward before relying on punishment. • An example (Kartub et al, JPBI, 2000)
Targeted Group Supports • For those students who exhibit difficulties despite proactive school-wide prevention efforts • Likely to be student with both academic & behavioral challenges • Approximately 10% of school population
Remember… Without school-wide prevention, we cannot reliably identify targeted-level students.
Using Data to Select Interventions Who are the students who need additional support? (referrals by student, targeted:2-5 referrals, intensive: 6 or more referrals) What are the interventions? (link to SW) What is the referral process? (teacher support-quick, easy, ) What is the time frame students get access to the intervention? (72 hours) What is the process to determine function? • FACTS, student questionnaire, role of academics, hypothesis statement, team process? Does the SST have access to the data for ongoing monitoring of intervention?
Tertiary Prevention: Interagency Partnerships Community Partnerships Court/ Institutional Liaisons Spot Light On Schools/ P.O.s Maryland’s Tomorrow Program Homeless Program NW/SW IEP Team Individual Student IEP/ 504 Plans Student Therapeutic Support Student Threat Assessments Abuse and Neglect Reporting Program (CPS Liaisons) Traumatic Loss Teams Baltimore County 2004-2005 32 Schools: 14 ES, 12 MS, 6 HS ~5% ~15% Secondary Prevention: Project Attend/ FACE School Resource Officer Program D.A.R.E./ S.A.D.D. Programs Student Assistance Programs Wellness Centers Health Action Plans/ Appraisals Peer Helper/ Mediation Programs Pupil Personnel Home Visits/ Social Histories Instructional Support Teams (IST) Functional Behavior Assessments Behavior Intervention Plans Educational/ Psychosocial Assessments Psychological Assessments Student Case Management Social Skills, Anger Management, Conflict Resolution Parent Presentations/ Trainings Alternative School/Program Placements Primary Prevention: School Improvement Planning School Emergency Safety Plans Positive Behavior Plans/ Codes Character Education Programs Parent/ Family Resources Student Support Teams Health Screenings/ Protocols School Nurse/ Assistant Services Essential Guidance Curriculum School Counselor Services Pupil Personnel Services Residency/ Attendance Officer Services School Social Work Services School Psychologist Services ~80% of Students
Targeted and Intensive /Programs/Initiatives Name of school: County: School Year 2005-06 Recommendations: 1. What programs groups can we eliminate? 2. What programs groups can we combine? 3. What programs groups need to be supported for improved outcomes and sustained functioning?
Targeted and Intensive /Programs/Initiatives Name of school: County: School Year 2005-06 Recommendations: 1. What programs groups can we eliminate? 2. What programs groups can we combine? 3. What programs groups need to be supported for improved outcomes and sustained functioning?
Conduct Brief Functional Assessment Is the behavior maintained by peer attention? Is the behavior maintained by escape from social interaction? Is the behavior related to lack of academic skills? Escape Motivated BEP Reduce adult interaction Use escape as a reinforcer • BEP + Academic Support • Increase academic support Peer Motivated BEP Allow student to earn reinforcers to share with peers Horner, Hawken, Marsh
Summary of PBIS “BIG IDEAS” Systems (How things are done) • Team based problem solving • Data-based decision making • Long term sustainability Data (How decisions are made) • On going data collection & use • ODR’s (# per day per month, location, behavior, student) • Suspension/expulsion, attendance, tardies Practices (How staff interact with students) • Direct teaching of behavioral expectations • On-going reinforcement of expected behaviors • Functional behavioral assessment