Download
1 / 11
220 likes | 718 Vues
Urban Structure. What do you need to know today?. Differences in the structure of urban areas can lead to differences in the quality of life of the inhabitants. 2. Urban models attempt to show those differences. How does urban structure affect quality of life?.

E N D
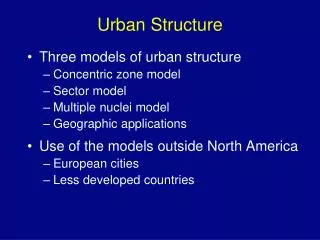
Urban Structure What do you need to know today? • Differences in the structure of urban areas can lead to differences in the quality of life of the inhabitants. 2. Urban models attempt to show those differences.
How does urban structure affect quality of life? The way that an urban area is structured is extremely important as it affects the three quality of life environments (built, social and economic): 1 BUILT – housing tenure, location, access to services, etc. 2 SOCIAL – education, health, friends, leisure pursuits, etc. 3 ECONOMIC – housing and transport costs, job location, etc.
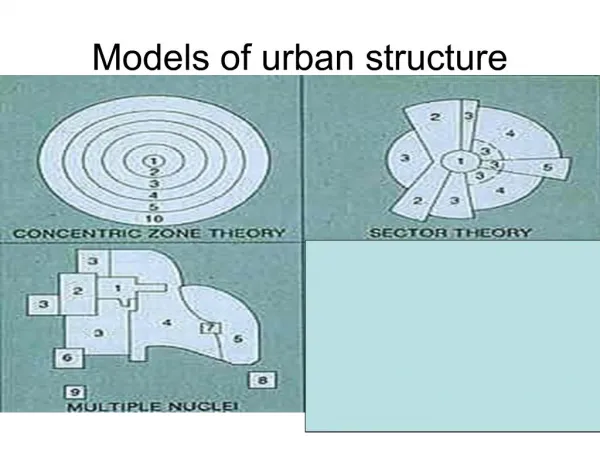
Urban Model 1:Burgess’ Concentric Zone Model Burgess suggested that towns grew outward from the centre in a concentric pattern. This means that buildings become more recent closer to the edge of a city. It is possible that up to 5 rings may develop: A - Central Business District (CBD): - most accessible to the largest number of people - contains services such as shops, offices, banks, etc. - multi-storey buildings as land is very expensive (build upwards to save cost)
Urban Model 1:Burgess’ Concentric Zone Model B - ‘Twilight Zone’ - has 2 sections: 1 - wholesale light manufacturing (transitional) 2 - low class residential (old inner city areas): - 19 Century terraced buildings - no gardens - cheap, dirty slum areas - GRID IRON street pattern - high rise blocks were built after slums were pulled down - attract crime - old industries found here
Urban Model 1:Burgess’ Concentric Zone Model C - Council Estates: Semi-detached housing with gardens in large estates. Less expensive private estates also here. Not top quality (medium class residential). INTER WAR AREA D - Commuter Zone: High class residential area. Private, top quality housing. Detached and semi-detached on cheap land. People can live here as are prepared to pay to get to work.
Urban Model 1:Burgess’ Concentric Zone Model E - Countryside Areas (suburb / exurbs): Countryside surrounding the urban area. Can also contain villages / hamlets in which town / city workers live.
Urban Model 2:Hoyts’ Sector Model Hoyt proposed the idea that towns grew as sectors or "wedges". That means that if, for example, industry grew up in one part of a 19th century town, future industry would then develop in that sector. As the town grew, so would the area of industry and therefore it would grow out in a wedge shape. A – Central Business District B1 – Wholesale Light Manufacturing B2 – Low Class Residential C – Council Estates D – Commuter Zone (Suburbs) E - Countryside
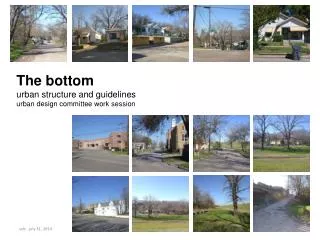
City Transect Increase in vegetation This city transect shows a cross section through a city. The CBD is located in the centre of the diagram and the other areas are clearly marked. On your diagram, add 10 labelled arrows which show changes in the three quality of life environments towards and away from the centre of the city. Examples: traffic, costs, vegetation, etc.
City Transect Examples of labels Increase in vegetation Increase in building height Decrease in traffic congestion Increase in crime Increase in housing cost Decrease in space Decrease in land costs Increase in competition for land Decrease in services Decrease in car ownership
Urban Model 3:LEDC Model Cities in LEDCs have a very different land use pattern to those in MEDCs. The CBD is dominated by modern administrative and commercial activities. Richer people live in modern high-rise apartments around the CBD. Recently arrived migrants from rural areas live in derelict land and on the outskirts. Housing quality decreases with distance from the CBD, unlike in MEDCs, where quality increases with distance from the CBD.